Generosity Reporting Made Clear
TL;DR
Most church leaders don’t lack giving data, they lack clear, usable visibility into generosity trends. The updated OnlineGiving.org Reports Hub delivers automated, email-first reports that surface one clear Health Score, key lifecycle insights, and pastoral care signals in under 60 seconds. Instead of hunting through dashboards, leaders receive actionable clarity that supports better board conversations, stronger stewardship, and more intentional shepherding.
When was the last time you logged into your giving dashboard, not because finance needed a number, but because you genuinely wanted to understand how your church’s generosity is doing? If you’re like most senior pastors and executive leaders, it’s probably been a while.
That might seem harmless, except the health of your church’s generosity influences nearly every major decision you make. Staffing plans, ministry expansion, missions commitments, facility improvements, and long-term sustainability are all shaped by generosity trends. Yet many churches are making those decisions with limited visibility into deeper patterns. A strong month can hide declining retention. A successful campaign can mask drifting engagement. A stable budget can conceal quiet disengagement among long-time families.
The problem isn’t a lack of data. It’s that most giving reports live inside dashboards busy leaders rarely open. So we asked a different question: What if generosity reporting didn’t require you to go looking for it? What if it came to you?
From Dashboards to Inbox: Removing the Friction
Church leaders don’t need more logins. They need clarity. The updated OnlineGiving.org Reports Hub delivers four automated reports directly to your inbox, weekly, monthly, or annually, formatted to be read in under 60 seconds. There’s no navigating menus, exporting spreadsheets, or waiting on finance. The insight simply arrives. And when data becomes frictionless, it becomes usable.
One Number That Starts the Right Conversation
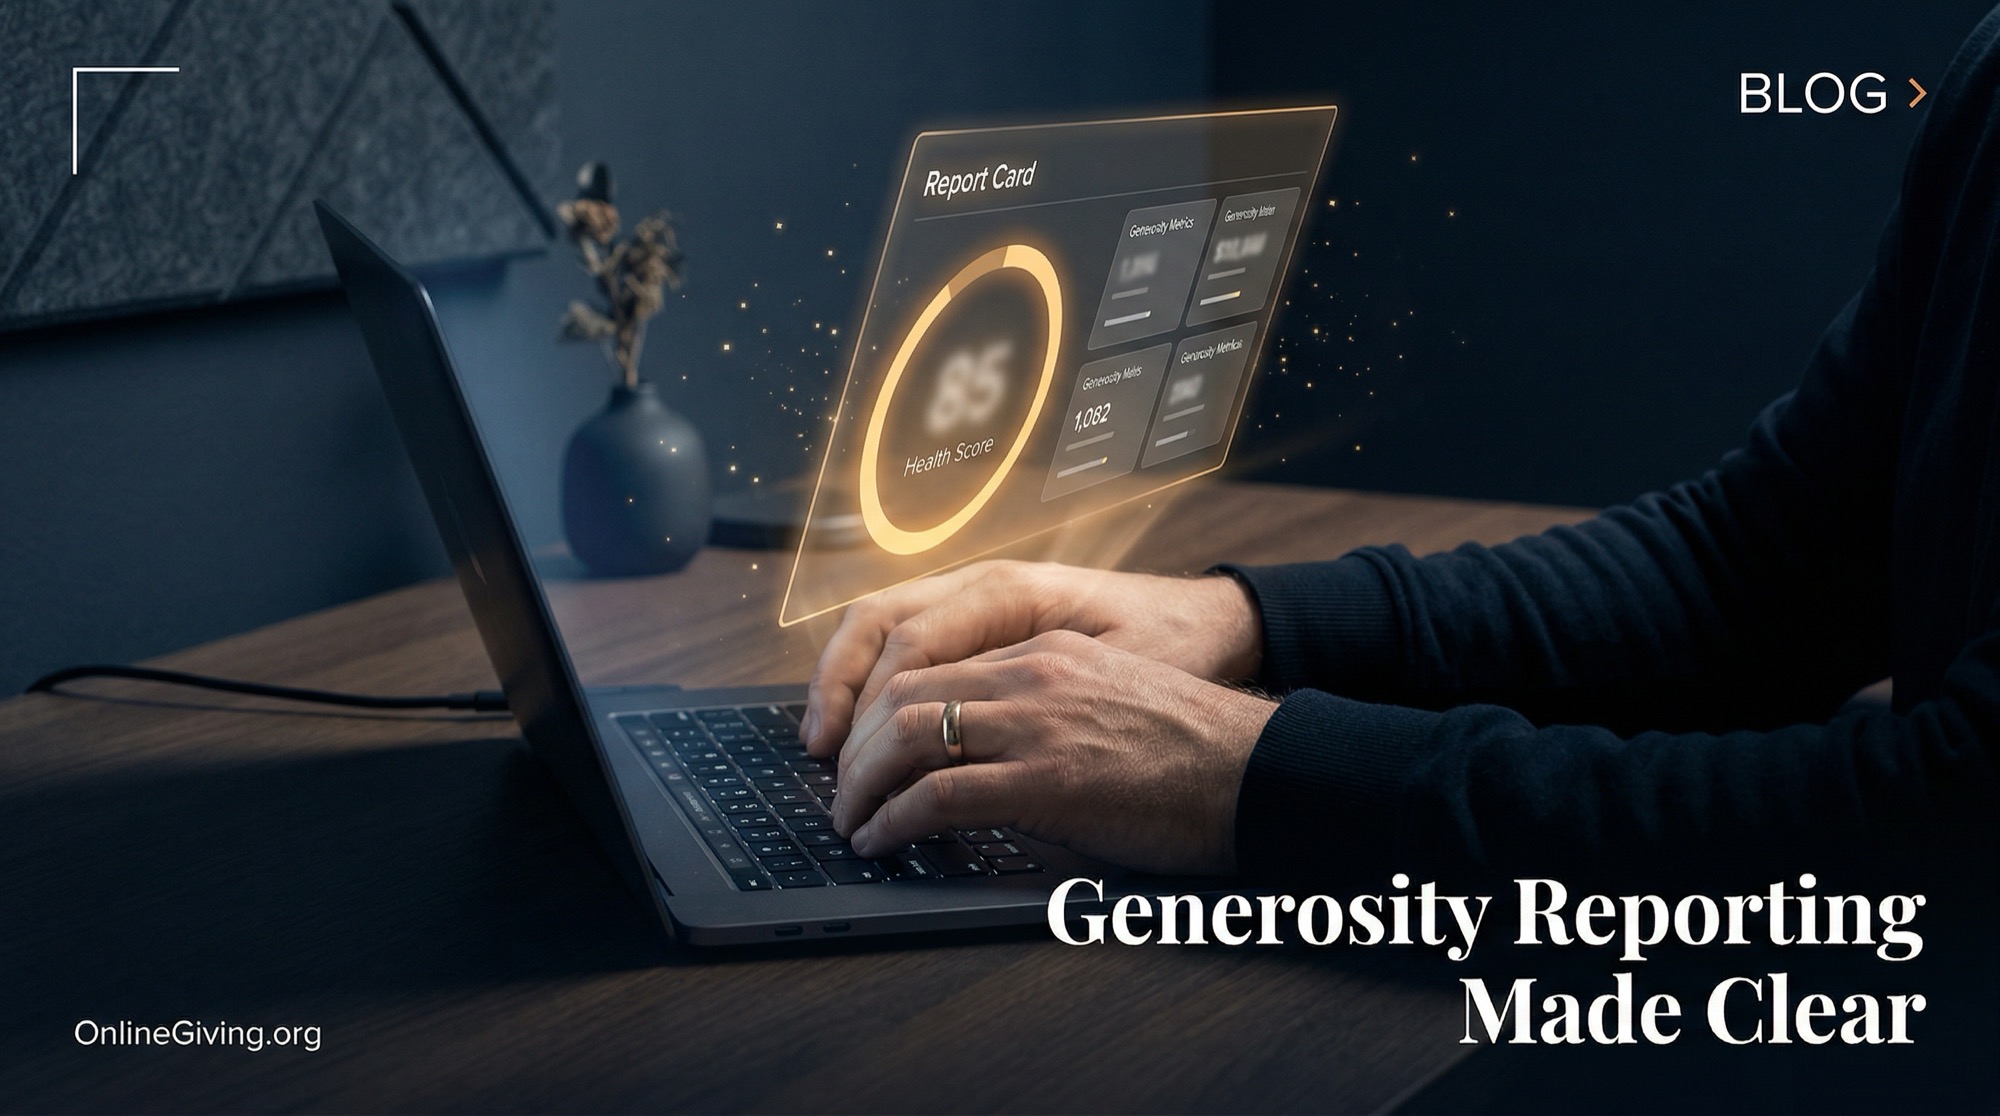
Every Generosity Snapshot centers around a single metric: your Generosity Health Score (0–100). It’s calculated from four key indicators: year-over-year growth, new giver engagement, giver retention, and recurring giving stability. Boards don’t just ask, “How much did we receive?” They ask, “How are we doing?” The Health Score gives your leadership team a clear, measurable answer without drowning in spreadsheets.
Below the score, leaders can see total giving and unique givers, donor lifecycle breakdowns (first-time, returning, lapsed, upgraded, recurring), recurring versus one-time patterns, fund-level insights, and plain-language year-over-year comparisons. Each report also includes an AI-generated executive summary written in pastoral language that highlights wins to celebrate and areas to watch. The result is clear, focused, actionable insight.
When Reporting Becomes Shepherding
This is where generosity reporting shifts from financial management to pastoral care. The Pastoral Care Report analyzes giving rhythms and flags members whose patterns suggest they may be drifting, not to pressure them, but to care for them. Members are grouped into three tiers: Priority Care for those significantly overdue, Personal Outreach for those beginning to drift, and Gentle Check-In for those slightly off pattern. Each entry includes tenure, days since last gift, typical frequency, and last care interaction so your team can respond thoughtfully and compassionately.
Consider this scenario: On a Monday morning, a pastor opens his report and sees three longtime families listed under Priority Care. Each had given consistently for years, and all three quietly stopped. By midweek, he connects with them. One family had experienced a sudden job loss. Another was navigating a medical crisis. The third had simply drifted during a difficult season. Without visibility, months might have passed unnoticed. With it, care happened quickly.
Often, disengagement shows up quietly before anyone says a word. Giving rhythm can be an early indicator that something in a family’s life has shifted. And when everyone is engaged, the report celebrates that too: “Your Congregation Is Fully Engaged.” That’s not just financial data, that’s discipleship visibility.
The Right Data to the Right Leaders
Not every leader needs every number. Multi-site churches receive campus-level snapshots so campus pastors can see their own congregation’s giving health without noise from other locations. Fund-level reports provide ministry-specific insights for missions, youth, or capital campaigns, complete with lifecycle tracking and recurring metrics. Each report has its own schedule and recipient list, eliminating the need for forwarding spreadsheets, building custom exports, or navigating internal bottlenecks. Clarity reaches the right leaders at the right time.
AI That Speaks Pastor
Artificial intelligence can feel intimidating, but here it serves one simple purpose: translation. It translates complex giving patterns into language pastors naturally use. It highlights ministry implications rather than just financial fluctuations and surfaces what matters most in 30–60 seconds. It doesn’t replace discernment; it accelerates understanding.
Why This Matters More Than Ever
Generosity culture shifts gradually. Retention trends reveal engagement. Recurring giving reflects stability. New giver percentages indicate openness and growth. Lapsed patterns can signal disconnection. If those trends aren’t visible, they’re difficult to shepherd wisely.
Proverbs 27:23 instructs leaders to “know well the condition of your flocks.” In today’s church context, that includes understanding generosity rhythms, not as a financial audit, but as a reflection of engagement and discipleship health. Healthy donor retention often reflects sustained connection, and strong recurring participation often reflects deeper commitment. When you can see those patterns clearly, you can respond wisely by celebrating growth, strengthening culture, and caring for those who drift.
A Better Way to Lead
Church leaders are called to steward both mission and people. That requires visibility, visibility into trends, engagement, and quiet warning signs before they become crises. The best generosity reporting doesn’t exist to track dollars. It exists to help pastors lead with clarity, respond with care, and steward generosity with wisdom.
When insight arrives on Monday morning, surfacing families who need encouragement, highlighting growth worth celebrating, and equipping your board with a clear picture of health, reporting stops being administrative. It becomes part of shepherding. And that’s leadership.
Generosity Reporting Made Clear Series
1. Generosity Reporting Made Clear
2. From Insight to Action: Leading with the Generosity Snapshot
3. From Insight to Care: Shepherding with the Stewardship Pastoral Care Report
4. From Insight to Clarity: Seeing Generosity in Every Ministry
Most church leaders don’t need more dashboards.
— Online Giving (@onlinegivingorg) February 20, 2026
They need clarity.
What if generosity insights showed up in your inbox, ready in 60 seconds?
Giving reports that help you shepherd, not just spreadsheet. https://t.co/ydjOD28zrt pic.twitter.com/OO0vgeeDOy