Feature Updates 02/25/2026
See the Impact of Generosity: Fee Coverage Adoption Tracking & Revenue Intelligence
Overview
When donors cover processing fees, it is a powerful act of additional generosity. Now you can measure exactly how that generosity is growing. This dedicated section within every Generosity Snapshot reveals adoption rates, total fees covered, average coverage per transaction, and year-over-year trends — turning a simple checkbox into a trackable revenue strategy.

Location & Access
Location: Admin > Giving > Reports > Generosity Snapshot (or Fund Snapshot, Campus Snapshot)
Who can use it: Users with Donor Admin role.
Entry points:
- Admin > Giving > Reports > Generosity Snapshot card > View Report
- Admin > Giving > Reports > Fund Snapshot or Campus Snapshot card > View Report
- The Fee Coverage section appears between Payment Methods and Fund Breakdown in the report flow
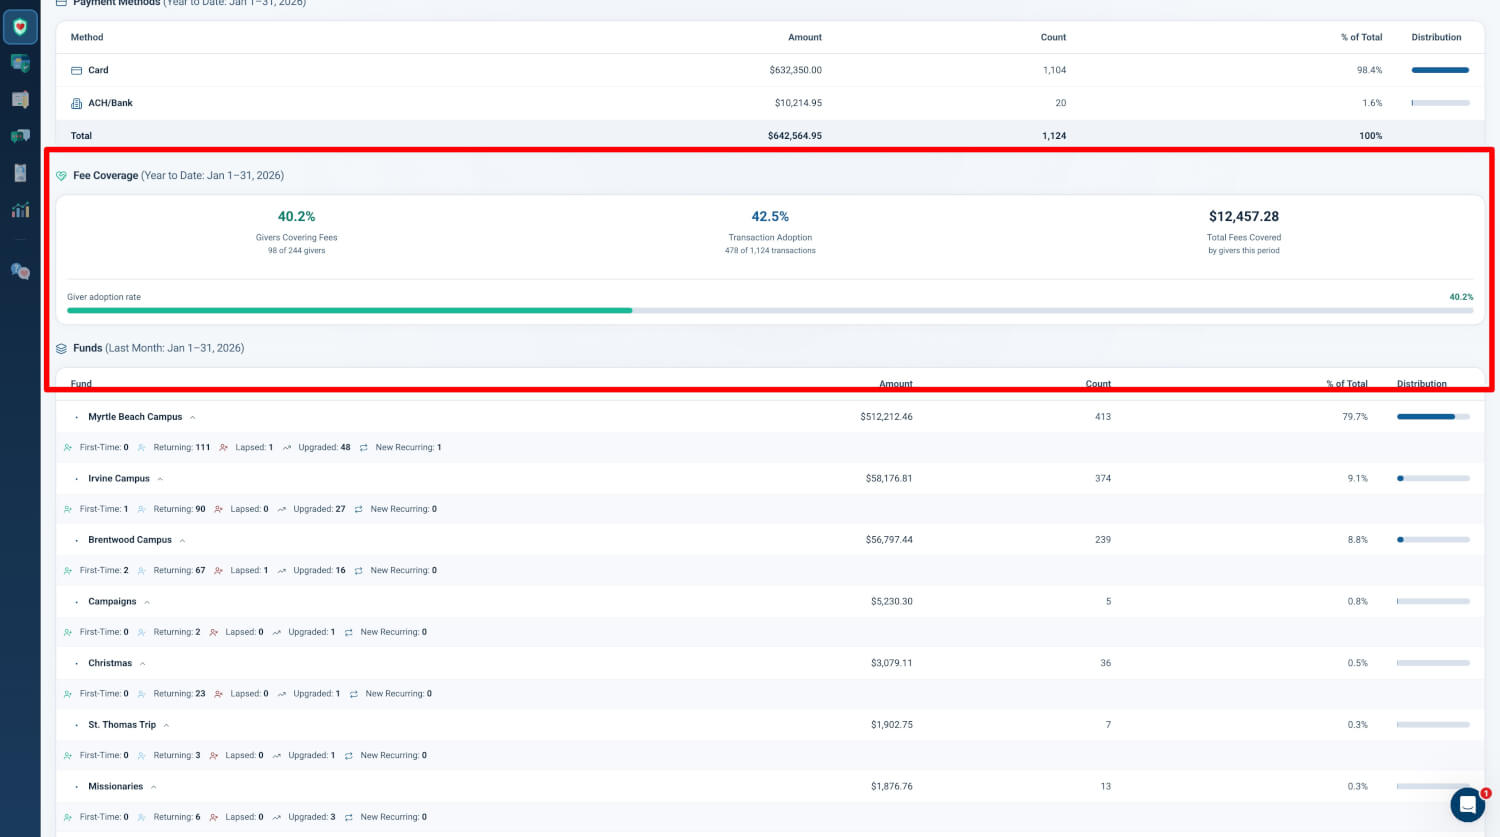
Section Title & Scope
The section displays as Fee Coverage (Year to Date: {date range}). Data is scoped to the primary period (YTD for Current, equivalent period for Last Week, Last Month, or Annual Review) and respects all snapshot filters including period, fund, and campus.
Overview Metric Cards
The section presents three metric cards in a horizontal layout:
| Metric | Description |
|---|---|
| Coverage Rate | Percentage of transactions with fee coverage (transaction adoption rate) |
| Total Covered | Total dollar amount of fees covered by givers in the period |
| Giver Adoption | Percentage of unique givers who opted to cover fees, with count (e.g., "42.3% — 127 of 301 givers") |
A visual progress bar provides an at-a-glance indicator of giver adoption rate.
Why it matters: Organizations see 60–80% adoption when fee coverage is enabled. Typical recovery is $3–5 per covered transaction. Quick visibility into these metrics helps leaders assess donor willingness and the revenue impact of the Cover the Fee feature.
Fee Coverage Breakdown
The section surfaces the following metrics in card and progress form:
| Metric | Description |
|---|---|
| Transactions with Coverage | Count of transactions where the giver opted to cover the fee |
| Total Donations | Total transaction count for context (denominator for adoption rate) |
| Coverage Participation Rate | Percentage of transactions with fee coverage |
| Total Fees Covered | Sum of fees covered for covered transactions |
| Average Fee per Covered Transaction | Total fees covered divided by covered transaction count |
| YoY Coverage Change | Year-over-year trend indicating whether donor willingness to cover fees is increasing or decreasing |
Why it matters: YoY trends show whether donor willingness to cover fees is increasing or decreasing. Leaders can use this data to evaluate messaging, placement, and promotion of the Cover the Fee option.
Smart Visibility
The Fee Coverage Snapshot section only renders when there is data to show. Organizations that do not use the Cover the Fee feature or have had no fee coverage activity in the reporting period see no empty section or placeholder text.
Integration
The Fee Coverage section is integrated across all Generosity Snapshot surfaces:
| Surface | Status |
|---|---|
| Domain Snapshot (Control Panel) | Included |
| Fund Snapshot (Control Panel) | Included |
| Campus Snapshot (Control Panel) | Included |
| Generosity Snapshot Email Reports | Included |
| PDF Exports | Included |
| AI Executive Summary | Included |
Why it matters: Fee coverage data is included in the AI prompt context so the executive summary can reference coverage trends alongside payment methods, giving patterns, and donor lifecycle insights.