Feature Updates 03/05/2026
One Report, Every Answer: The Unified Product Sales Intelligence Engine
What's New
Stop jumping between spreadsheets and admin pages to understand your store performance. The new Product Sales Report is a powerhouse—a single, unified engine that lets you slice and dice sales data by Product, Collection, Order, or Customer with one click. AI-powered insights, powerful search and filter tools, full-screen order management, and CSV/Excel exports for sharing with your team. This is store intelligence, reimagined.
Where to Find It
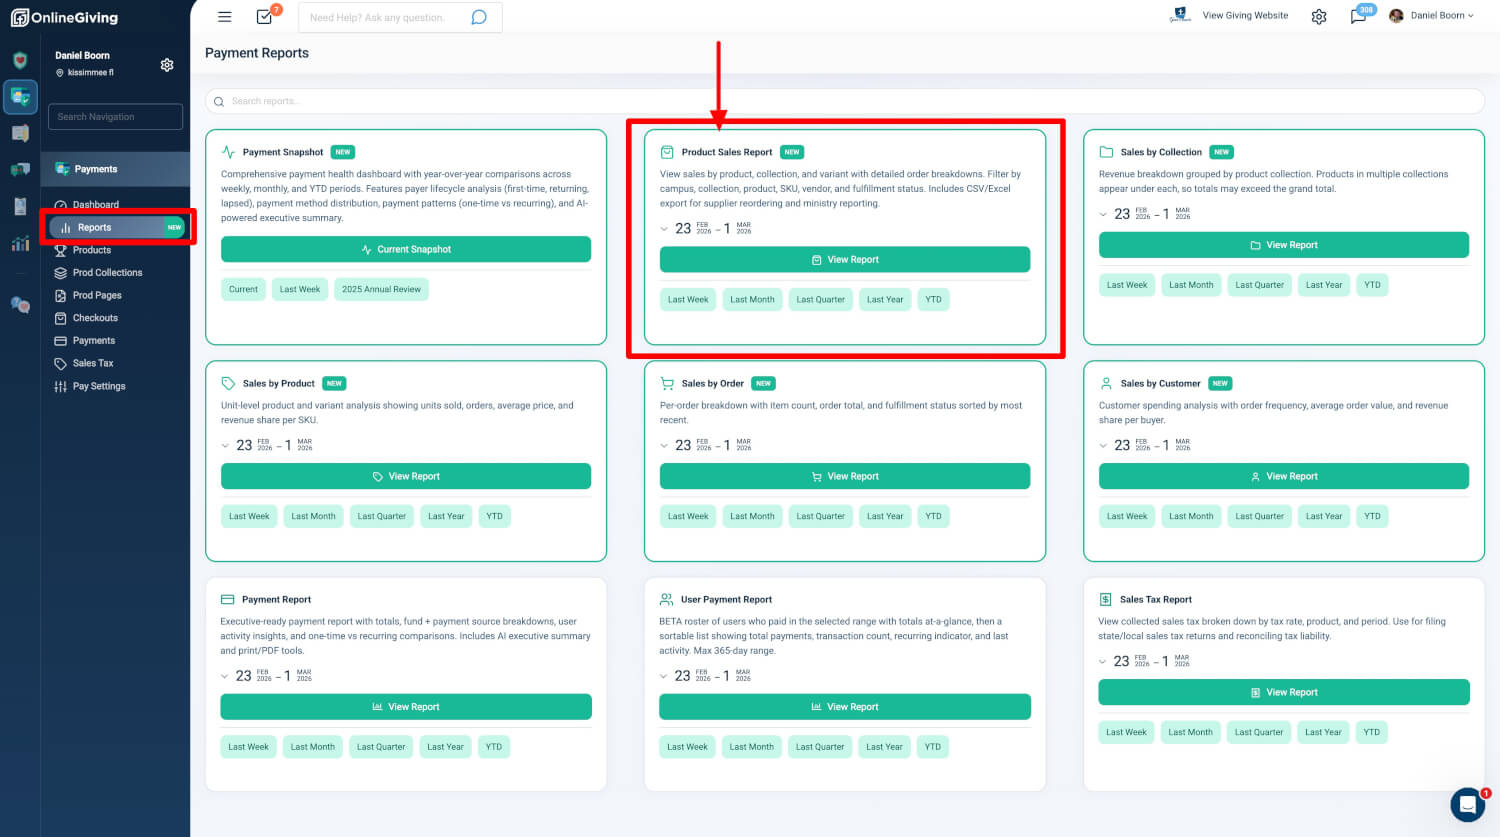
Path: Admin > Payment Reports > Product Sales Report
Who can use it: Any administrator with Donor Admin or Payments Admin role.
How to open: Payment Reports Hub > Product Sales Report card > View Report. Use the quick date shortcuts (Last Week, Last Month, Last Quarter, Last Year, YTD) or the custom date range picker before launching. You can also reach it from Products, Collections, Payments, and Checkouts admin pages with pre-applied filters.
Four View Modes
The report uses a View By toggle to switch between four grouping modes. All modes share the same filters, data set, and export options.
- Product — Groups by individual product and variant. Best for top sellers, reordering decisions, variant performance.
- Collection — Groups by product collection. Best for merchandising decisions, department-level reporting.
- Order — Groups by individual order. Best for fulfillment management, large-order identification.
- Customer — Groups by customer email. Best for retention analysis, top-spender identification.
Each mode has its own dedicated summary table with mode-specific columns, metric cards, and AI analysis structure.
Why it matters: Different stakeholders need different lenses on the same data. A single report with instant view switching eliminates context switching and ensures everyone works from the same filtered dataset.
Powerful Search and Filter Tools
The report provides powerful search and filter tools with dismissible filter chips so you can see exactly what criteria are active.
Primary Controls
- Date Range: Calendar picker with presets (Last Week, Last Month, etc.); defaults to last 90 days
- Status: Completed (default), Pending, Cancelled, or Refunded
- View By: Product, Collection, Order, or Customer toggle
- Run Report: Applies all filters
Scope Filters (Narrow Results)
- Campus: Multi-select; shown only for multi-campus organizations
- Collection: Multi-select from active collections
- Product: Multi-select from active products
- Fulfillment: Multi-select fulfillment statuses
Search & Refine
- Customer: Name or email search
- Variant: Variant name or value search
- Quantity, Price, Total: Search by exact values, ranges, or minimums
Advanced Filters (Expandable)
SKU search, Barcode search, Product Type multi-select, Vendor multi-select, Requires Shipping (Yes/No), Digital Product (Yes/No). A badge shows the count of active advanced filters.
Dismissible Filter Chips
All active filters appear as removable chips in the criteria bar. Clicking the X on any chip removes it and re-runs the report instantly.
Why it matters: Complex sales analysis requires precise scoping. The filter system lets you narrow from broad date/status down to specific products or customers without losing context. Filter chips make the active criteria visible and easy to adjust.
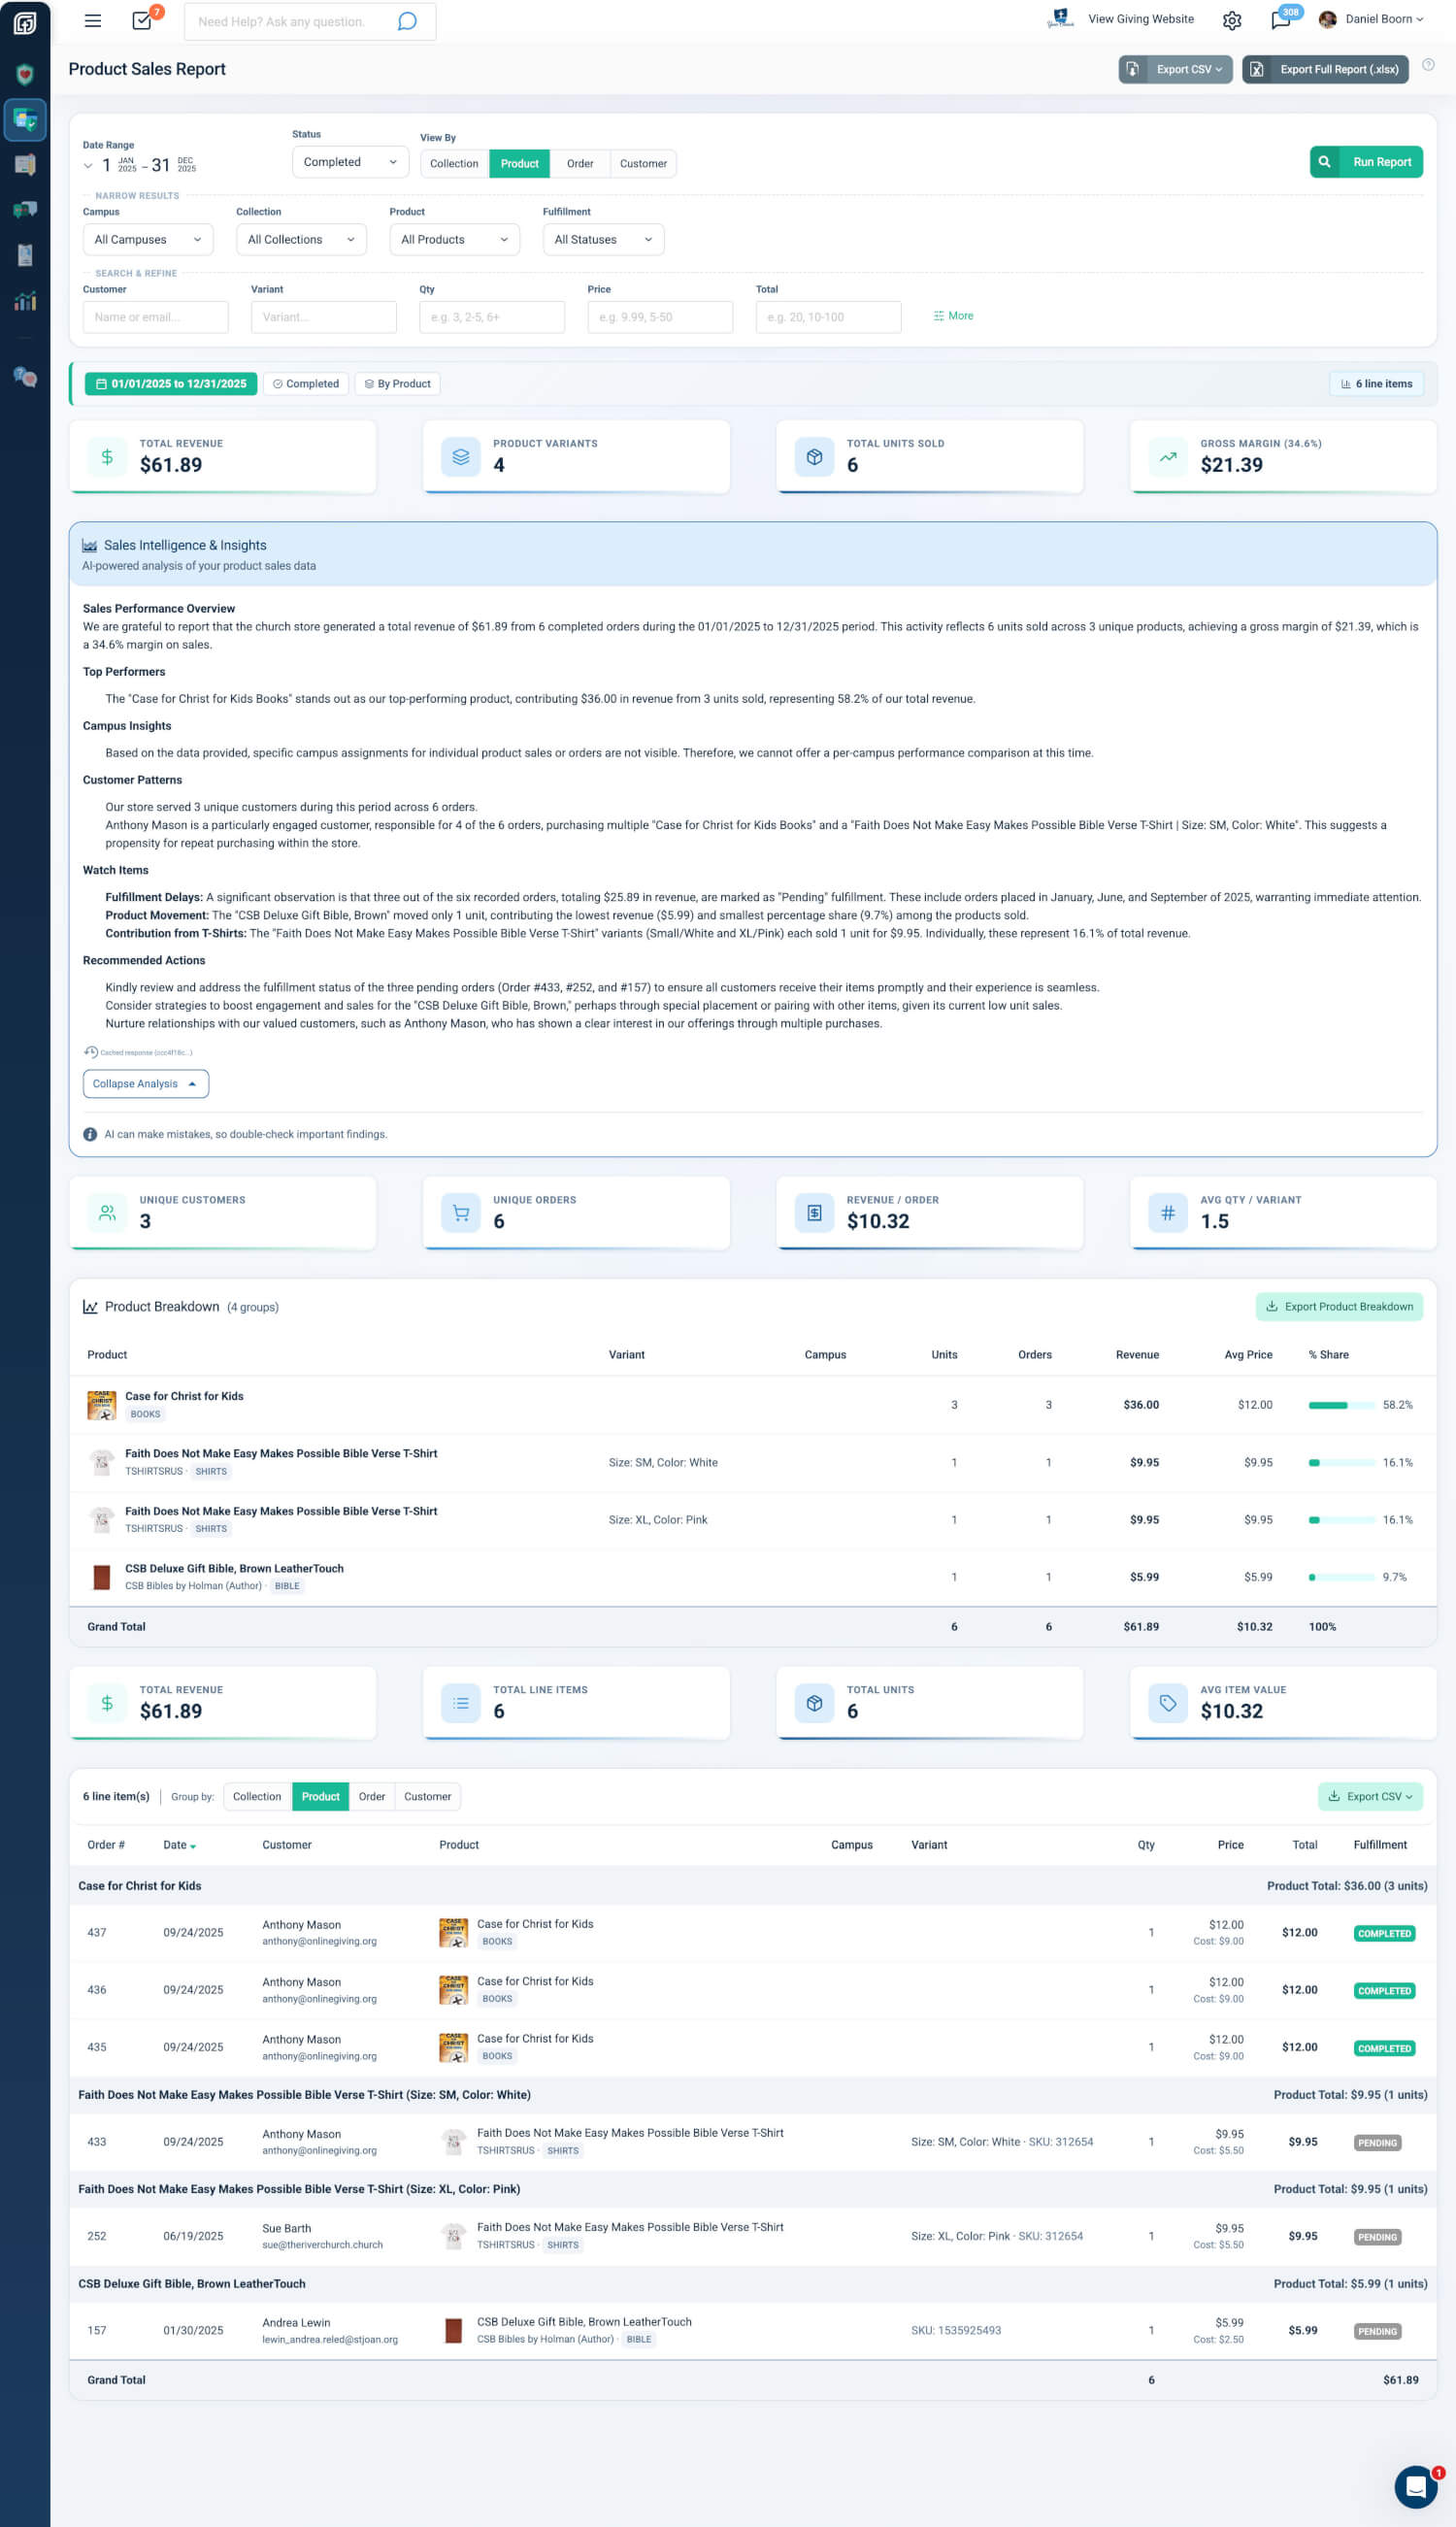
Summary Metric Cards
Three rows of four metric cards adapt to the current view mode.
- Row 1: Top metrics (e.g., Total Revenue, Product Variants, Total Units Sold, Avg Price per Unit)
- Row 2: Grouped summary metrics (e.g., Unique Customers, Unique Orders, Revenue per Order, Avg Qty per Variant)
- Row 3: Line items metrics (Total Revenue, Total Line Items, Total Units, Avg Item Value)
When cost data is available for 50% or more of items, the fourth card in Row 1 switches to Gross Margin with margin percentage.
Why it matters: At-a-glance metrics let administrators quickly assess performance without scrolling. Mode-specific cards ensure the most relevant KPIs surface for each view.
AI Sales Intelligence
An AI-powered Sales Intelligence & Insights panel generates a professional briefing automatically.
- Adaptation: Structure adapts to the current view mode (product performance, collection comparison, order distribution, or customer behavior)
- Content: Summarizes store performance with specific dollar amounts and counts; identifies top performers, patterns, and areas needing attention
- Recommendations: Provides concrete, actionable recommendations
- Display: Collapsible with "View Full Analysis" / "Collapse Analysis" toggle for longer analyses
- Disclaimer: Notes that AI can make mistakes
Why it matters: Raw metrics require interpretation. The AI briefing transforms dozens of data points into actionable strategic intelligence, reducing decision paralysis for store and leadership teams.
Grouped Summary Table
A mode-specific summary table displays aggregated totals per group.
- Columns: Mode-specific (units, revenue, orders, avg price, etc.)
- % Share: Column with visual progress bar (Product, Collection, Customer views)
- Grand Total: Footer row with totals
- Sorting: By revenue descending; Order view sorts by most recent date
- Export: Dedicated Export button for the current summary view
Why it matters: Grouped summaries answer "which products/collections/orders/customers drive the most revenue" at a glance. The dedicated export lets users share summary views without exporting full line items.
Line Items Table
Every individual order line item appears in a sortable, grouped table.
- Sortable Columns: Order #, Date, Customer (last name), Product, Qty, Total
- Product Display: Thumbnails with vendor and product type badges
- Variant Details: Variant, SKU, and barcode display
- Cost: Cost per item shown under price when available
- Fulfillment: Color-coded fulfillment status badges
- Group Headers: Subtotals matching the current view mode
- View By Toggle: Secondary toggle at the table header for quick mode switching
Why it matters: Line-level detail supports drill-down from summaries to individual transactions. The secondary View By toggle enables quick pivots without returning to the top filter panel.
Order Details Modal
Click any order to see full details and manage fulfillment. A full-screen modal opens with complete order management.
- Quick Actions: Print, Resend Email, Edit Payment Status (Refund / Bank Rejected / Cancelled), Gateway Refund
- Customer Info: Profile photo, contact details, quick-action dropdown (View All Checkouts, View Profile, Change User, Sign In As User)
- Payment Details: Visual payment card (Credit Card, ACH, Check, Cash) with masked numbers, processing fees, net amount
- Checkout Items: Full product list with thumbnails, variants, quantities, prices
- Fulfillment Management: View and edit fulfillment status, tracking code, shipping provider, ship date, shipping address, ship cost; Shippo integration with "Manage Order in Shippo" link and auto-sync
- Checkout Totals: Subtotal, covered fee, sales tax, order status, final total
- Shipping vs. Contact: Address map, IP/region info
- Change History: Audit trail of all order modifications
When the modal closes, the report restores your exact scroll position and briefly highlights the viewed row.
Why it matters: Administrators can handle refunds, resend confirmations, and manage fulfillment without leaving the report. Scroll preservation keeps context when reviewing multiple orders in sequence.
Exports
CSV Exports (No Row Limit)
Available from the page header and line items table header.
- All Line Items: Full export with complete order, product, shipping, tax, and collection data
- By Collection: Grouped detail rows with collection headers, line items, and subtotals
- By Product: Grouped detail rows by product/variant with line items and subtotals
- By Order: Grouped detail rows by order with full shipping, fulfillment, and line item data
- By Customer: Grouped detail rows by customer with shipping info, line items, and subtotals
Excel Export (.xlsx)
Single workbook with six sheets: Report Summary, Line Items, By Collection, By Product, By Order, By Customer. All monetary and quantity values stored as native Excel numbers. Limited to 10,000 line items (CSV has no limit).
Why it matters: Different export formats serve different workflows. CSV supports unlimited rows for data pipelines; Excel provides a structured multi-sheet report for sharing with stakeholders.
At a Glance
- Four View Modes: Product, Collection, Order, Customer; shared filters, data, and exports
- Powerful Filters: Date range, status, campus, collection, product, fulfillment, customer search, variant search, numeric ranges, SKU, barcode, vendor, product type, shipping/digital flags
- Dismissible Filter Chips: Visual filter indicators with one-click removal
- Summary Metric Cards: Three rows of four cards adapting to view mode; Gross Margin when 50%+ items have cost
- AI Sales Intelligence: Auto-generated briefing adapted to view mode; collapsible
- Grouped Summary Table: Mode-specific columns, % Share with progress bar, Grand Total footer, dedicated Export
- Line Items Table: Sortable columns, product thumbnails with badges, variant/SKU/barcode, cost per item, fulfillment badges, group headers with subtotals, secondary View By toggle
- Order Details Modal: Full-screen with Quick Actions, Customer Info, Payment Details, Fulfillment Management, Shippo integration, Change History; scroll position preservation and row highlight
- CSV Exports: Five types: All Line Items, By Collection, By Product, By Order, By Customer; no row limit
- Excel Export: Six-sheet workbook, 10K item limit
- Access: Donor Admin or Payments Admin role
Quick Start
- Go to Admin > Payment Reports and click the Product Sales Report card.
- Choose your date range and filters, then click Run Report.
- Use the View By toggle to switch between Product, Collection, Order, or Customer views—and click any order to see full details and manage fulfillment.