Feature Updates 03/06/2026
Department Performance at a Glance: Collection-Level Merchandising Intelligence
What's New
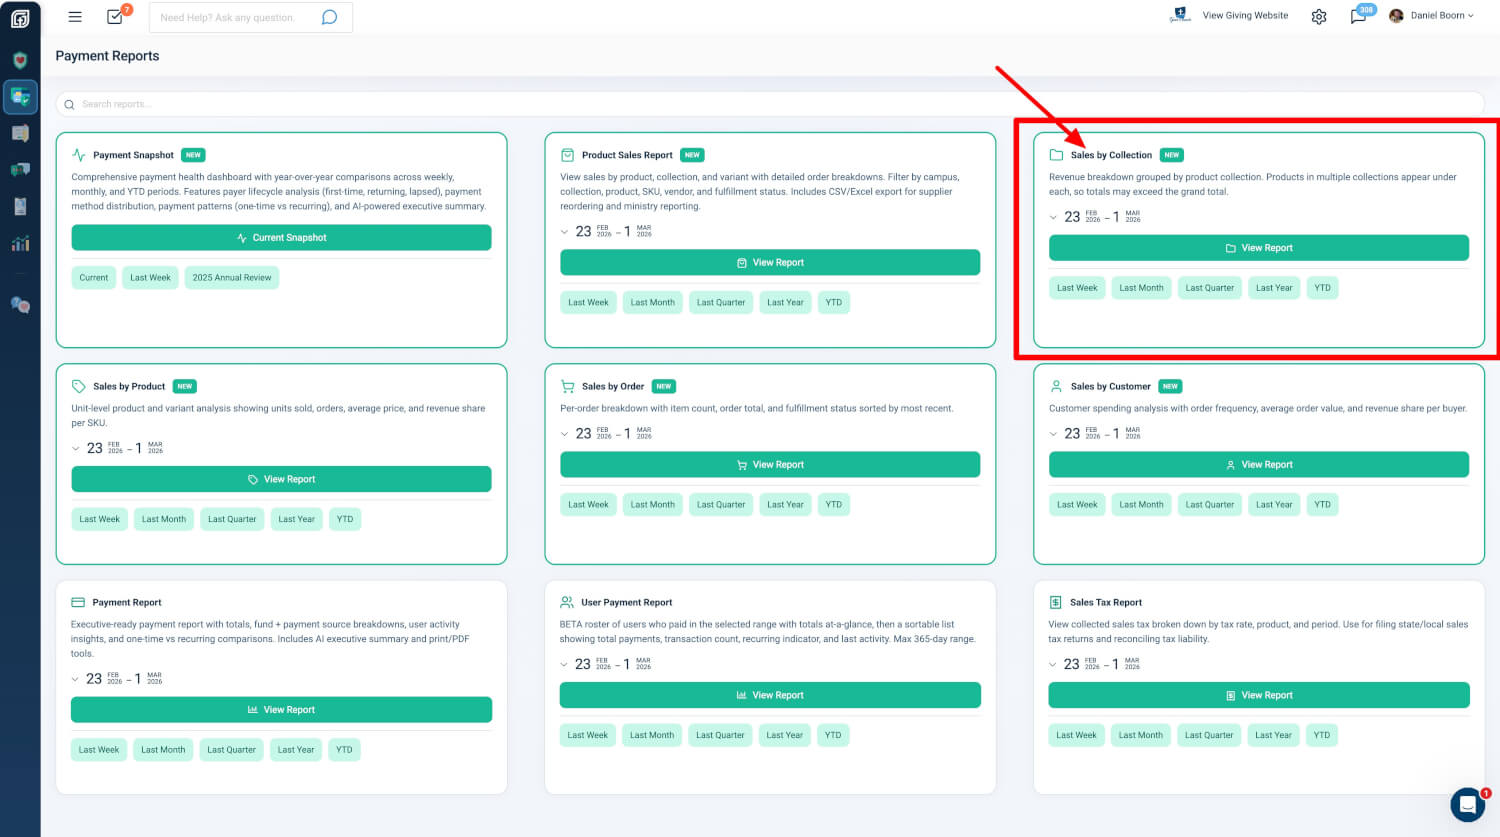
How are your product departments performing? Which collections drive the most revenue? The Sales by Collection view gives merchandising teams instant visibility into category-level performance with revenue share analysis, AI-powered insights, and dedicated exports. See which collections are thriving and which need attention — all from one powerful summary view.
Where to Find It
Path: Admin → Payment Reports → Sales by Collection
Who can use it: Any administrator with Donor Admin or Payments Admin role.
How to get there:
- From the Payment Reports hub, click the Sales by Collection card, then View Report
- From Products or Collections, use the Sales Report dropdown and choose Sales by Collection
- From Payments or Checkouts, use the Product Sales Report dropdown and choose Sales by Collection
Quick Start
- Go to Admin → Payment Reports and open Sales by Collection.
- Review the Collection Summary Table to see which collections bring in the most revenue.
- Use Export Collection Summary to download the breakdown, or drill into line items for order-level details.
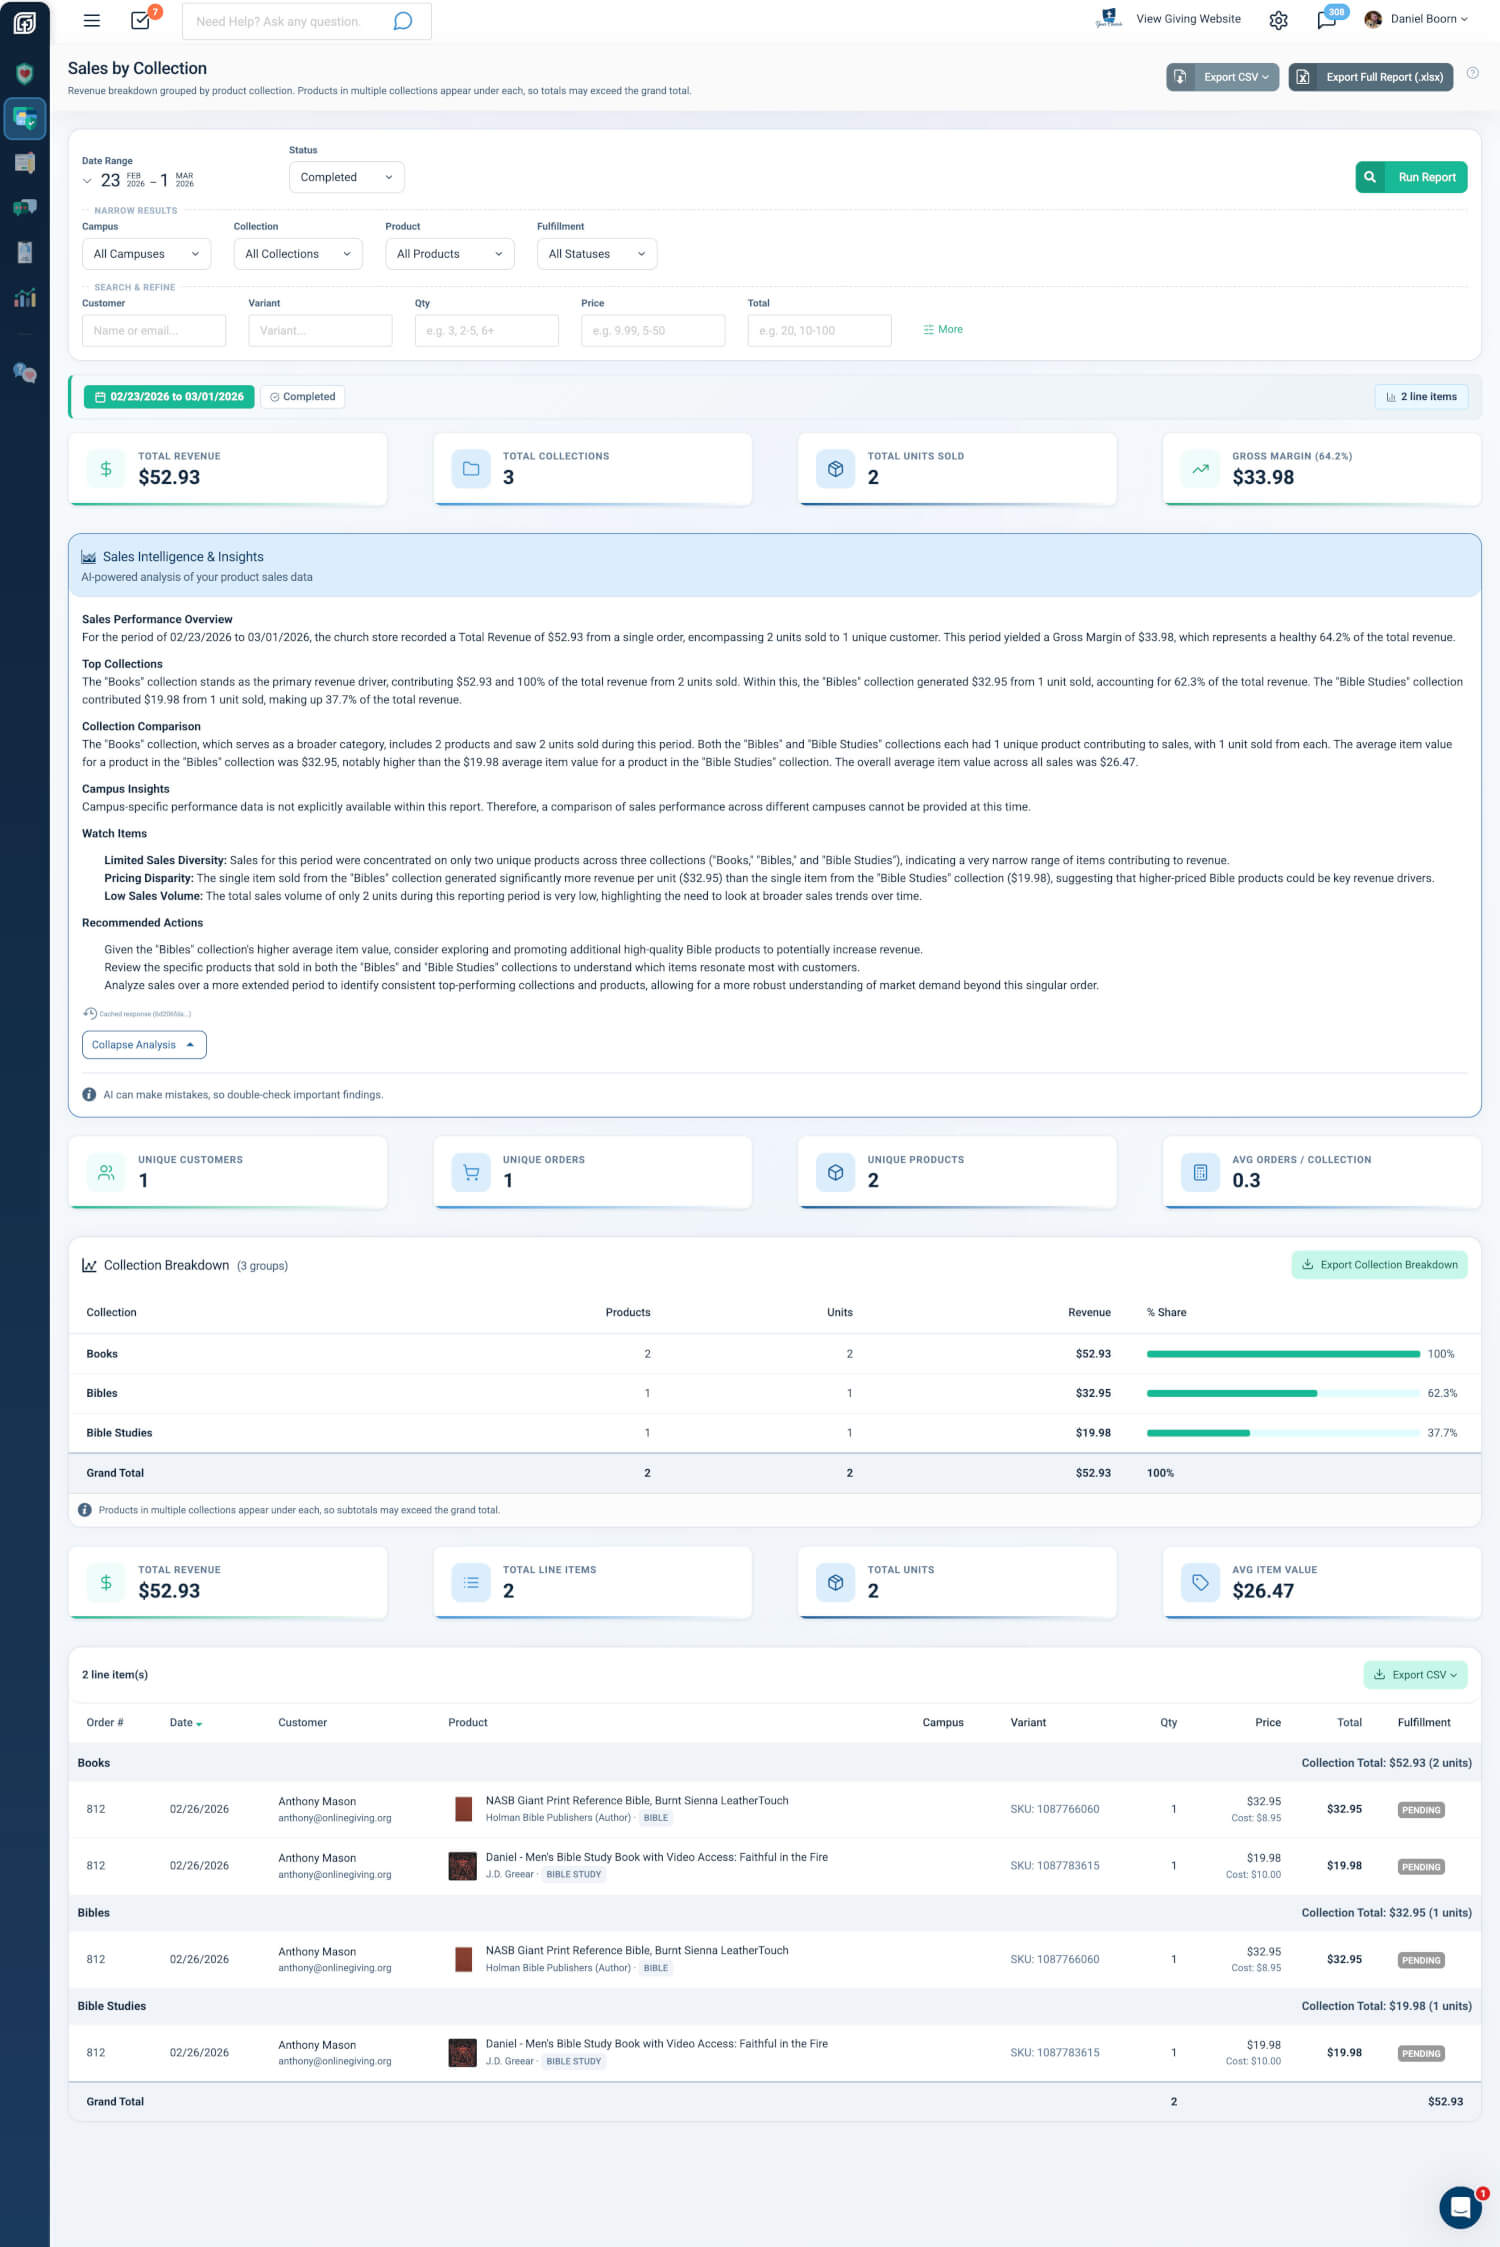
Collection Summary Table
The Collection Summary Table shows one row per product collection with key metrics.
- Collection Name: Name of the product collection
- Products: Number of distinct products in the collection
- Units: Total units sold from this collection
- Orders: Number of orders containing items from this collection
- Revenue: Total revenue attributed to the collection
- Avg Price: Average price per unit for the collection
- % Share: Percentage of total revenue with visual progress bar
The table is sorted by revenue, highest first. A Grand Total row at the bottom summarizes all collections. Use Export Collection Summary to download the collection breakdown as a CSV file.
Friendly tip: If a product appears in multiple collections, it shows up under each — so collection totals may add up to more than the grand total. This is by design, so you can see each collection's contribution clearly.
Practical outcome: You can quickly answer "which departments or categories perform best" and share collection-level reports without full line-item detail.
Collection-Specific Metric Cards
Two rows of metric cards give you a quick snapshot of collection performance.
- Row 1: Total Revenue, Collections, Total Units, Gross Margin (when 50%+ of items have cost data)
- Row 2: Unique Customers, Unique Orders, Products, Avg Price
Practical outcome: You can assess collection performance at a glance without scrolling. Gross Margin appears when cost data is available, so you can see profitability by category.
Line Items Under Collection Headers
Below the summary table, a full line items table shows every order line item grouped under collection headers. Each collection groups its products with subtotals. Click any row to open the full-screen invoice modal for fulfillment, refunds, email resend, and order editing.
Practical outcome: You can move from collection summaries straight to individual transactions for fulfillment and order verification. Group headers keep context when reviewing many line items.
AI Insights
The AI Sales Intelligence panel generates collection-focused analysis. The briefing highlights category performance, merchandising effectiveness, and patterns across collections. It includes specific dollar amounts, top collections, and actionable recommendations.
Practical outcome: Instead of interpreting raw numbers yourself, the AI briefing turns data into clear, strategic insights for merchandising and inventory decisions.
Exports
- CSV — Collection Summary: Grouped export with collection headers, line items, and subtotals; includes a note about multi-collection overlap
- Excel (.xlsx): Multi-sheet workbook including a Collections sheet; Report Summary, Line Items, By Collection, By Product, By Order, By Customer; limited to 10,000 line items
Practical outcome: CSV supports unlimited rows for your own analysis; Excel gives you a structured report with a dedicated Collections sheet for sharing with staff or leadership.
At a Glance
- Collection Summary Table: See which collections drive revenue, with Grand Total and % Share
- Export Collection Summary: Download the collection breakdown for reports and planning
- Cross-listing behavior: Products in multiple collections appear under each; totals may exceed grand total by design
- Collection-specific metric cards: Total Revenue, Units, Gross Margin, Unique Customers, Orders, Products, Avg Price
- Line items under collection headers: Drill from summaries to individual orders; click rows for invoice details
- AI Insights: Get collection-focused analysis and recommendations
- Exports: CSV (Collection Summary) and Excel (with Collections sheet)
- Access: Donor Admin or Payments Admin role