Feature Updates 03/07/2026
Know Your Best Buyers: Customer-Level Sales Intelligence & Retention Insights
What's New
Who are your most valuable customers? How often do they buy? What's their average order worth? The Sales by Customer view answers these questions instantly—ranking customers by revenue, revealing purchase frequency, and surfacing patterns that help you build deeper relationships with your buyers. Click any customer name to see their full profile, and let customer intelligence flow seamlessly into member care.
Where to Find It
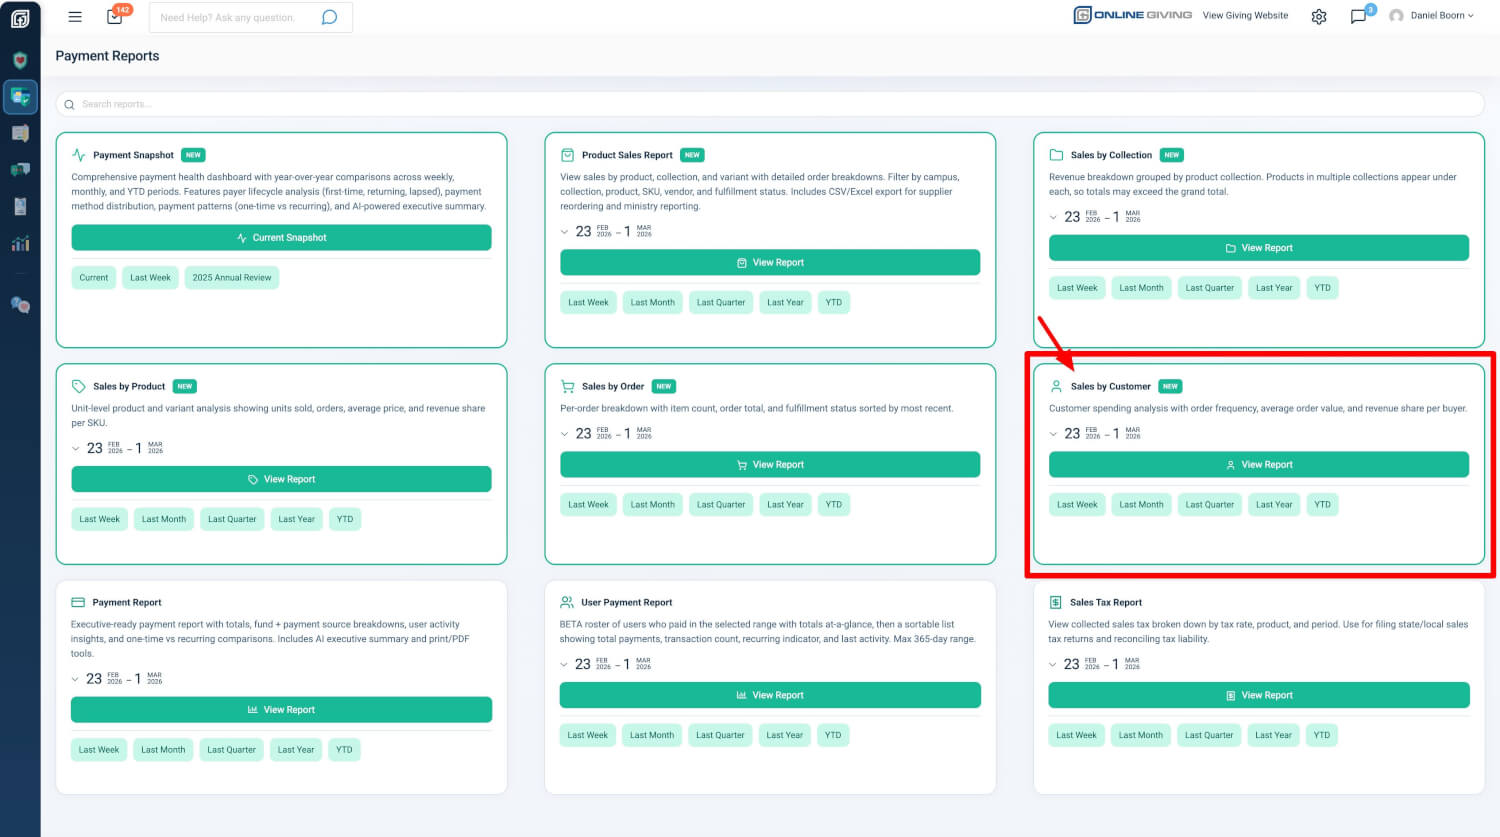
Path: Admin → Payment Reports → Product Sales Report → Sales by Customer
Who can use it: Any administrator with Donor Admin or Payments Admin role.
How to get there:
- From the Payment Reports hub, click the Sales by Customer card, then View Report
- Use the quick date shortcuts on the card: Last Week, Last Month, Last Quarter, Last Year, or Year to Date
Customer Summary Table
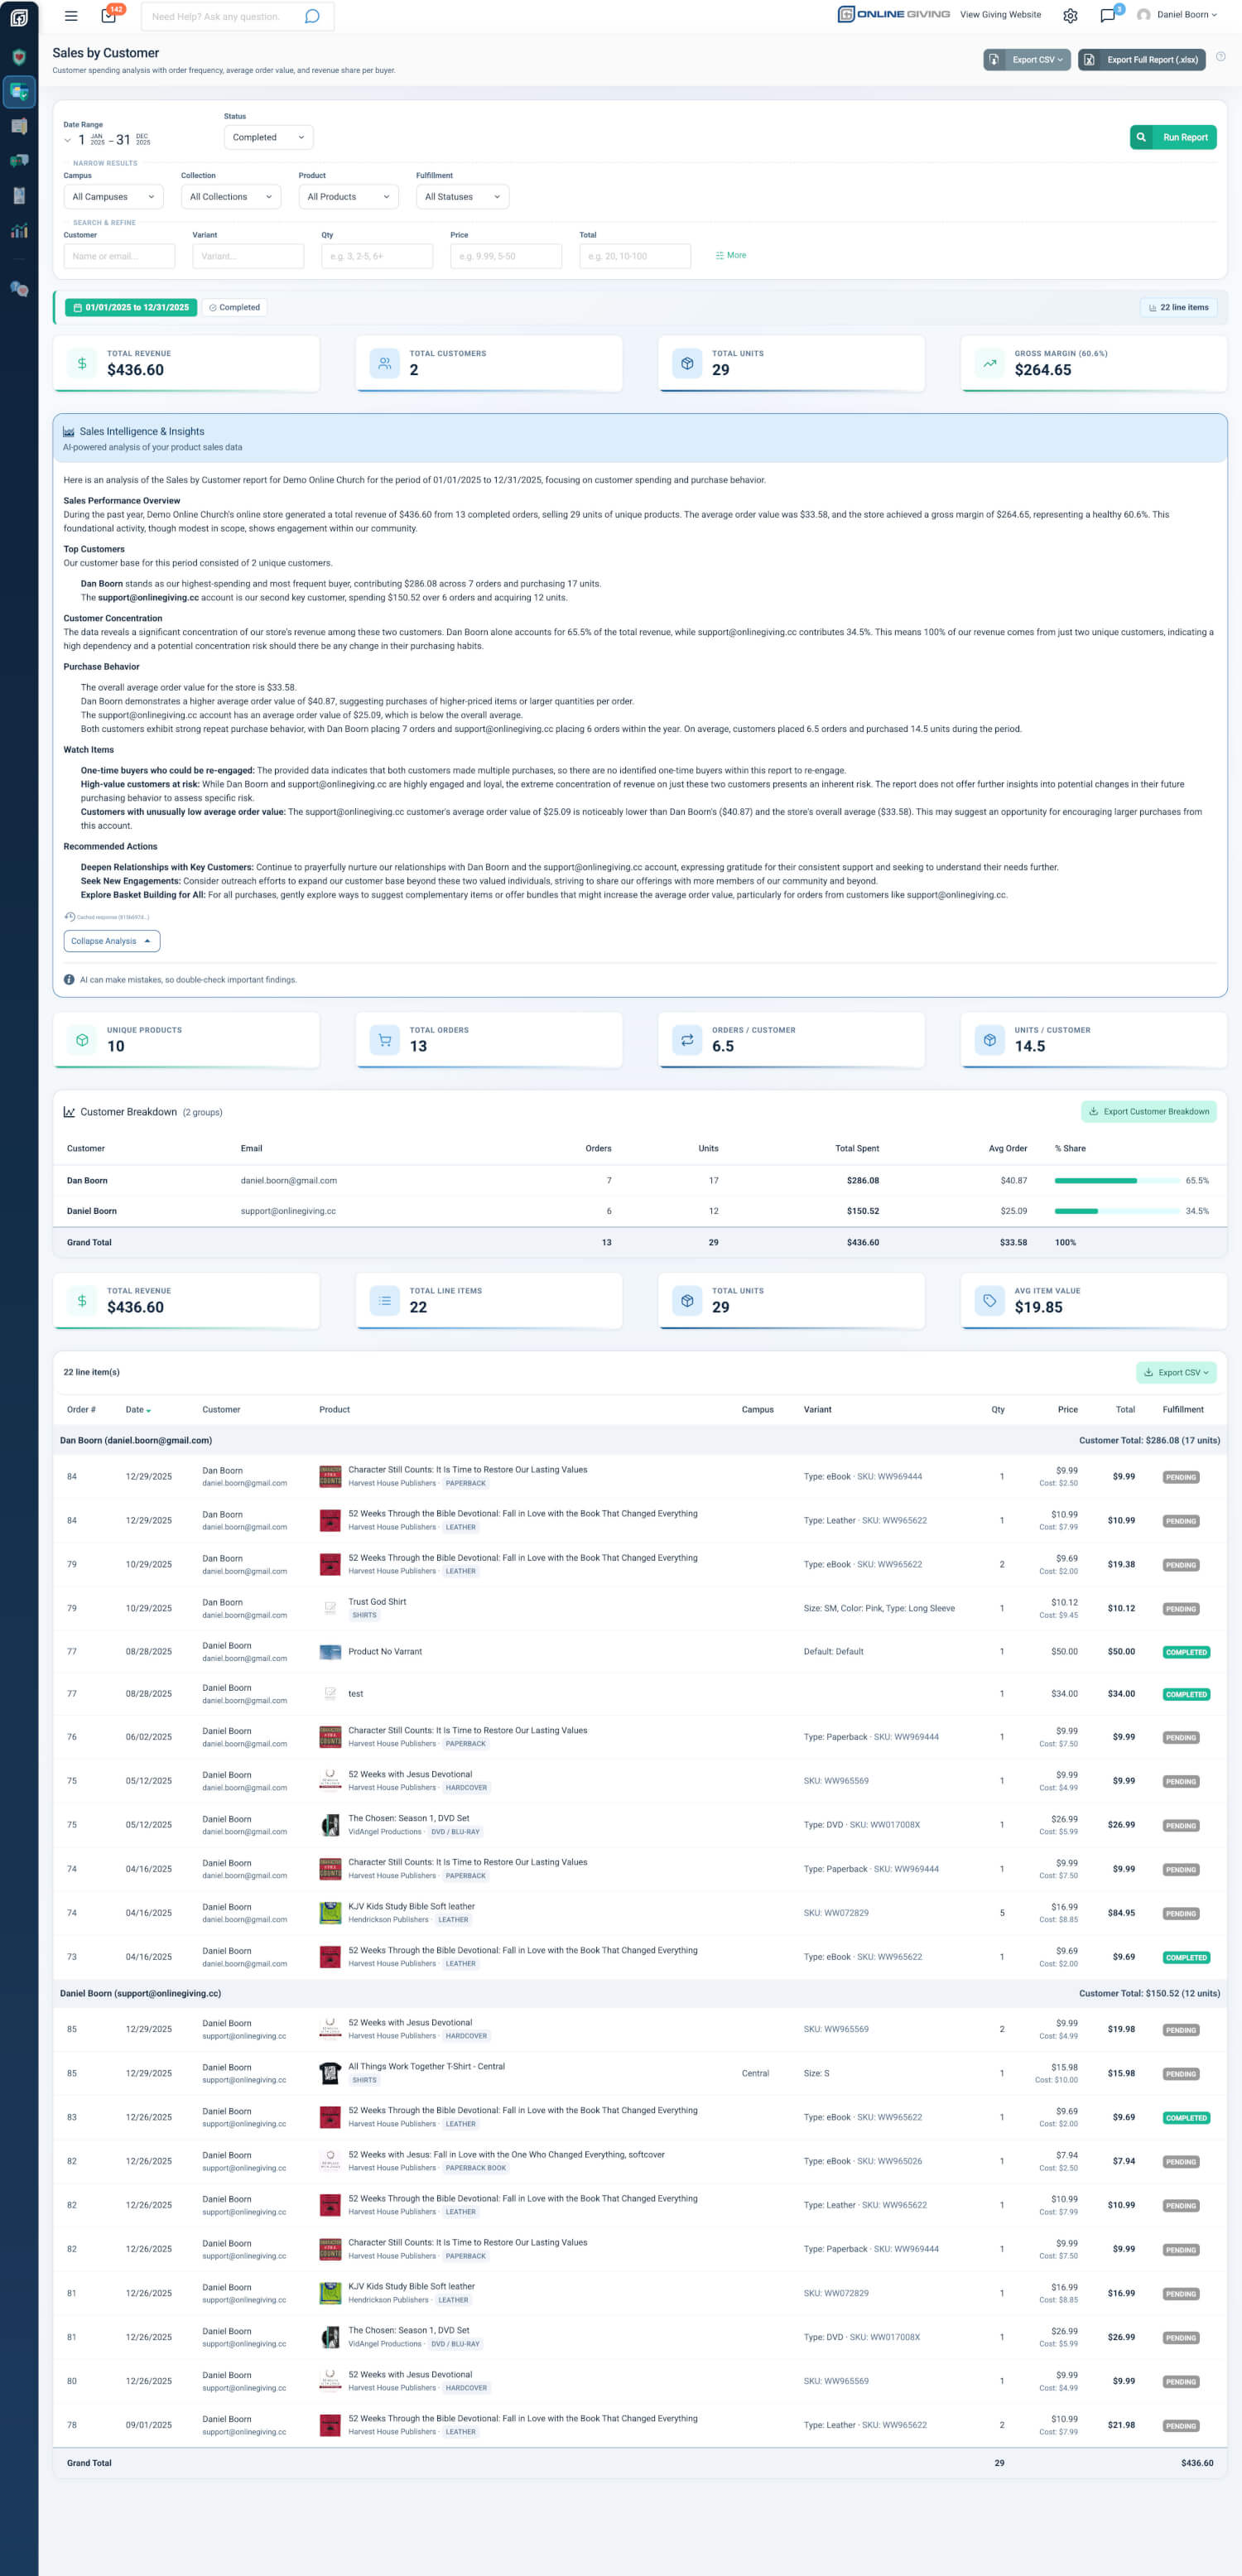
The Customer Summary Table shows one row per customer, sorted by revenue from highest to lowest.
- Customer Name: Click any name to open their full profile
- Orders: Number of orders placed in the date range
- Items: Total line items purchased
- Revenue: Total revenue from this customer
- Avg Order: Average order value
- % Share: Percentage of total revenue with visual ranking bars
A Grand Total row at the bottom shows totals across all customers. Use Export Customer Summary to download the summary table for sharing or planning.
Practical outcome: Quickly spot your top spenders and see where revenue is concentrated. One click from a customer name takes you to their full profile for follow-up, thank-yous, or support.
Line Items Under Customer Headers
Below the summary table, line items are grouped under clear customer headers. Each customer section shows their purchases with product details and thumbnails.
- Customer Header: Visual header with customer name
- Product Details: Product name, variant, quantity, price, total
- Thumbnails: Product images for quick visual identification
- Row Click: Opens the full invoice for order management
Practical outcome: Move from summary totals straight into specific purchases per customer without losing context. Product thumbnails make it easy to scan large order histories.
Customer-Specific Metric Cards
Two rows of metric cards give you the numbers that matter for the customer view.
- Row 1: Total Revenue, Unique Customers, Avg Revenue per Customer, Avg Orders per Customer
- Row 2: Unique Orders, Product Variants, Total Units, Gross Margin
Gross Margin appears when cost data is available for at least half of your items.
Practical outcome: See "how many customers bought" and "how much do they spend on average" at a glance. The second row supports merchandising and margin decisions within the customer lens.
AI-Powered Analysis of Your Customer Patterns
The AI Sales Intelligence panel generates analysis tailored to your customers:
- Top Spenders: Identifies highest-value customers by revenue
- Retention Patterns: Highlights repeat buyers vs. one-time purchasers
- Customer Value Distribution: Analyzes revenue concentration and dependency risk
- Repeat Purchase Behavior: Patterns in order frequency and basket size
Practical outcome: Raw numbers need interpretation. The AI briefing turns customer data into clear retention and growth recommendations, so store and leadership teams can act with confidence instead of getting stuck in the data.
One-Click Access to Full Profiles
The Customer Name column links directly to each customer's full profile. Click any name to view giving history, engagement, care assessment, and other profile sections.
Practical outcome: Move from sales data to the complete user record in one click—ideal for customer service, VIP outreach, and re-engagement without leaving the report.
Exports
- CSV — Customer Summary: Dedicated Export Customer Summary button; downloads the summary table only
- CSV — By Customer: Grouped detail rows with customer headers, line items, and subtotals
- Excel (.xlsx): Multi-sheet workbook including a Customers sheet with customer-level data
Practical outcome: Share top-customer lists quickly with the Customer Summary CSV. Use the Excel Customers sheet for stakeholder reports and retention analysis.
Quick Start
- Go to Admin → Payment Reports and open the Sales by Customer card.
- Choose a date range (Last Week, Last Month, Last Quarter, Last Year, or Year to Date).
- Click View Report—your top customers are ranked by revenue with visual ranking bars and one-click access to their profiles.
At a Glance
- Customer Summary Table: Spot top spenders and revenue concentration at a glance
- Visual ranking bars: See each customer's share of total revenue instantly
- Click any customer name: Jump to their full profile for follow-up and care
- Line items under headers: Drill from totals into specific purchases per customer
- Metric cards: Answer "how many customers" and "how much per customer" without scrolling
- AI-powered analysis: Turn customer data into retention and growth recommendations
- Exports (CSV, Excel): Share top-customer lists and run retention analysis