Feature Updates 03/09/2026
Your Top Sellers, Revealed: Product & Variant Performance Intelligence
What's New
Which products are flying off the shelves? Which variants are underperforming? The Sales by Product view delivers item-level intelligence that drives inventory decisions, pricing strategy, and merchandising. Visual ranking bars, AI-powered product analysis, and dedicated exports give you the data you need to stock what sells and sunset what doesn't. This is the default view when you open the Product Sales Report.
Where to Find It
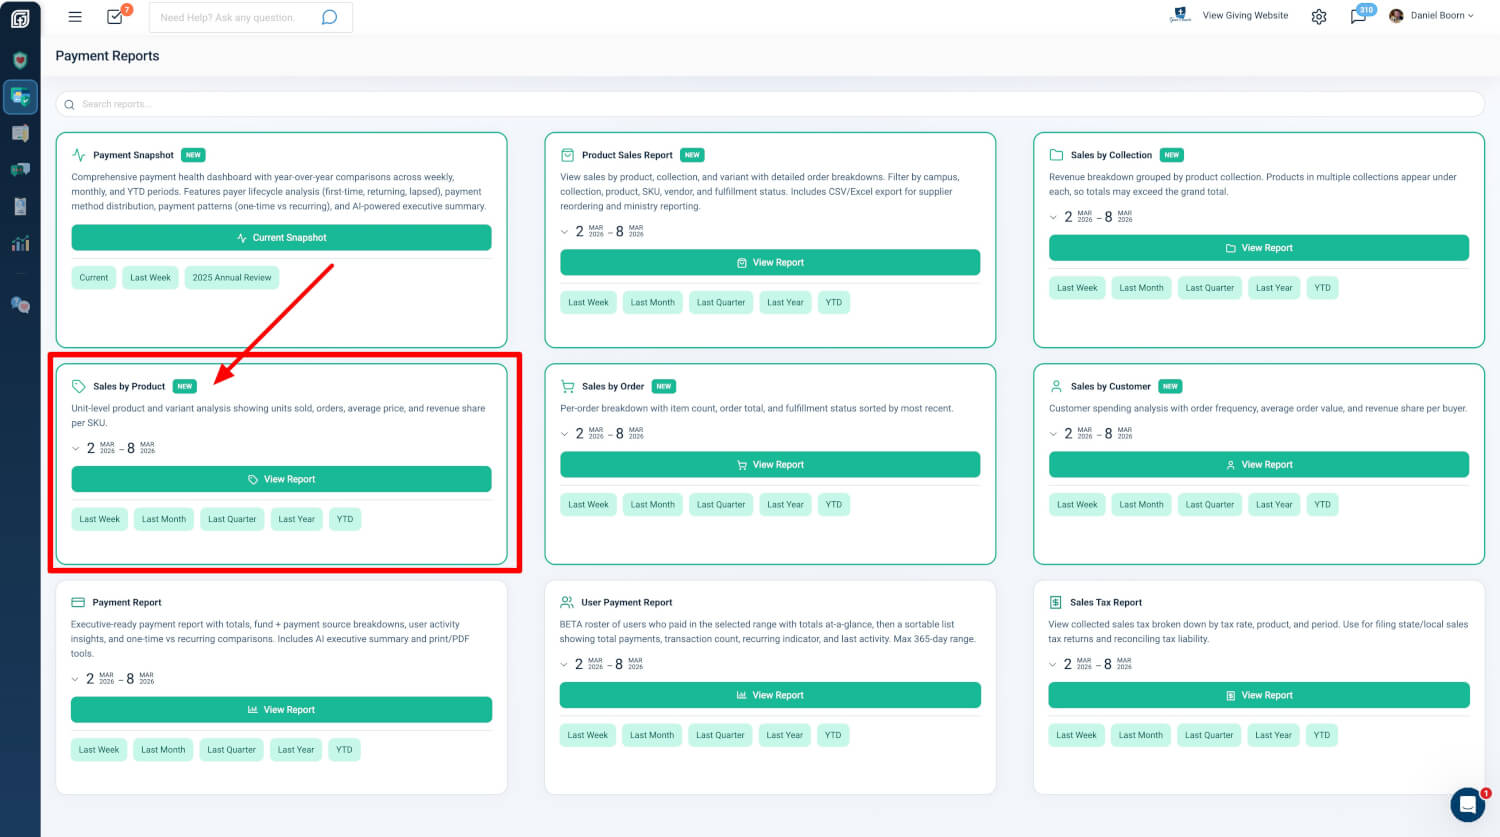
Path: Admin → Payment Reports → Product Sales Report → Sales by Product
Who can use it: Any administrator with Donor Admin or Payments Admin role.
How to get there:
- From the Payment Reports hub, click the Sales by Product card, then View Report
- Use the quick date shortcuts on the card: Last Week, Last Month, Last Quarter, Last Year, or Year to Date
- Set a custom date range on the card before launching
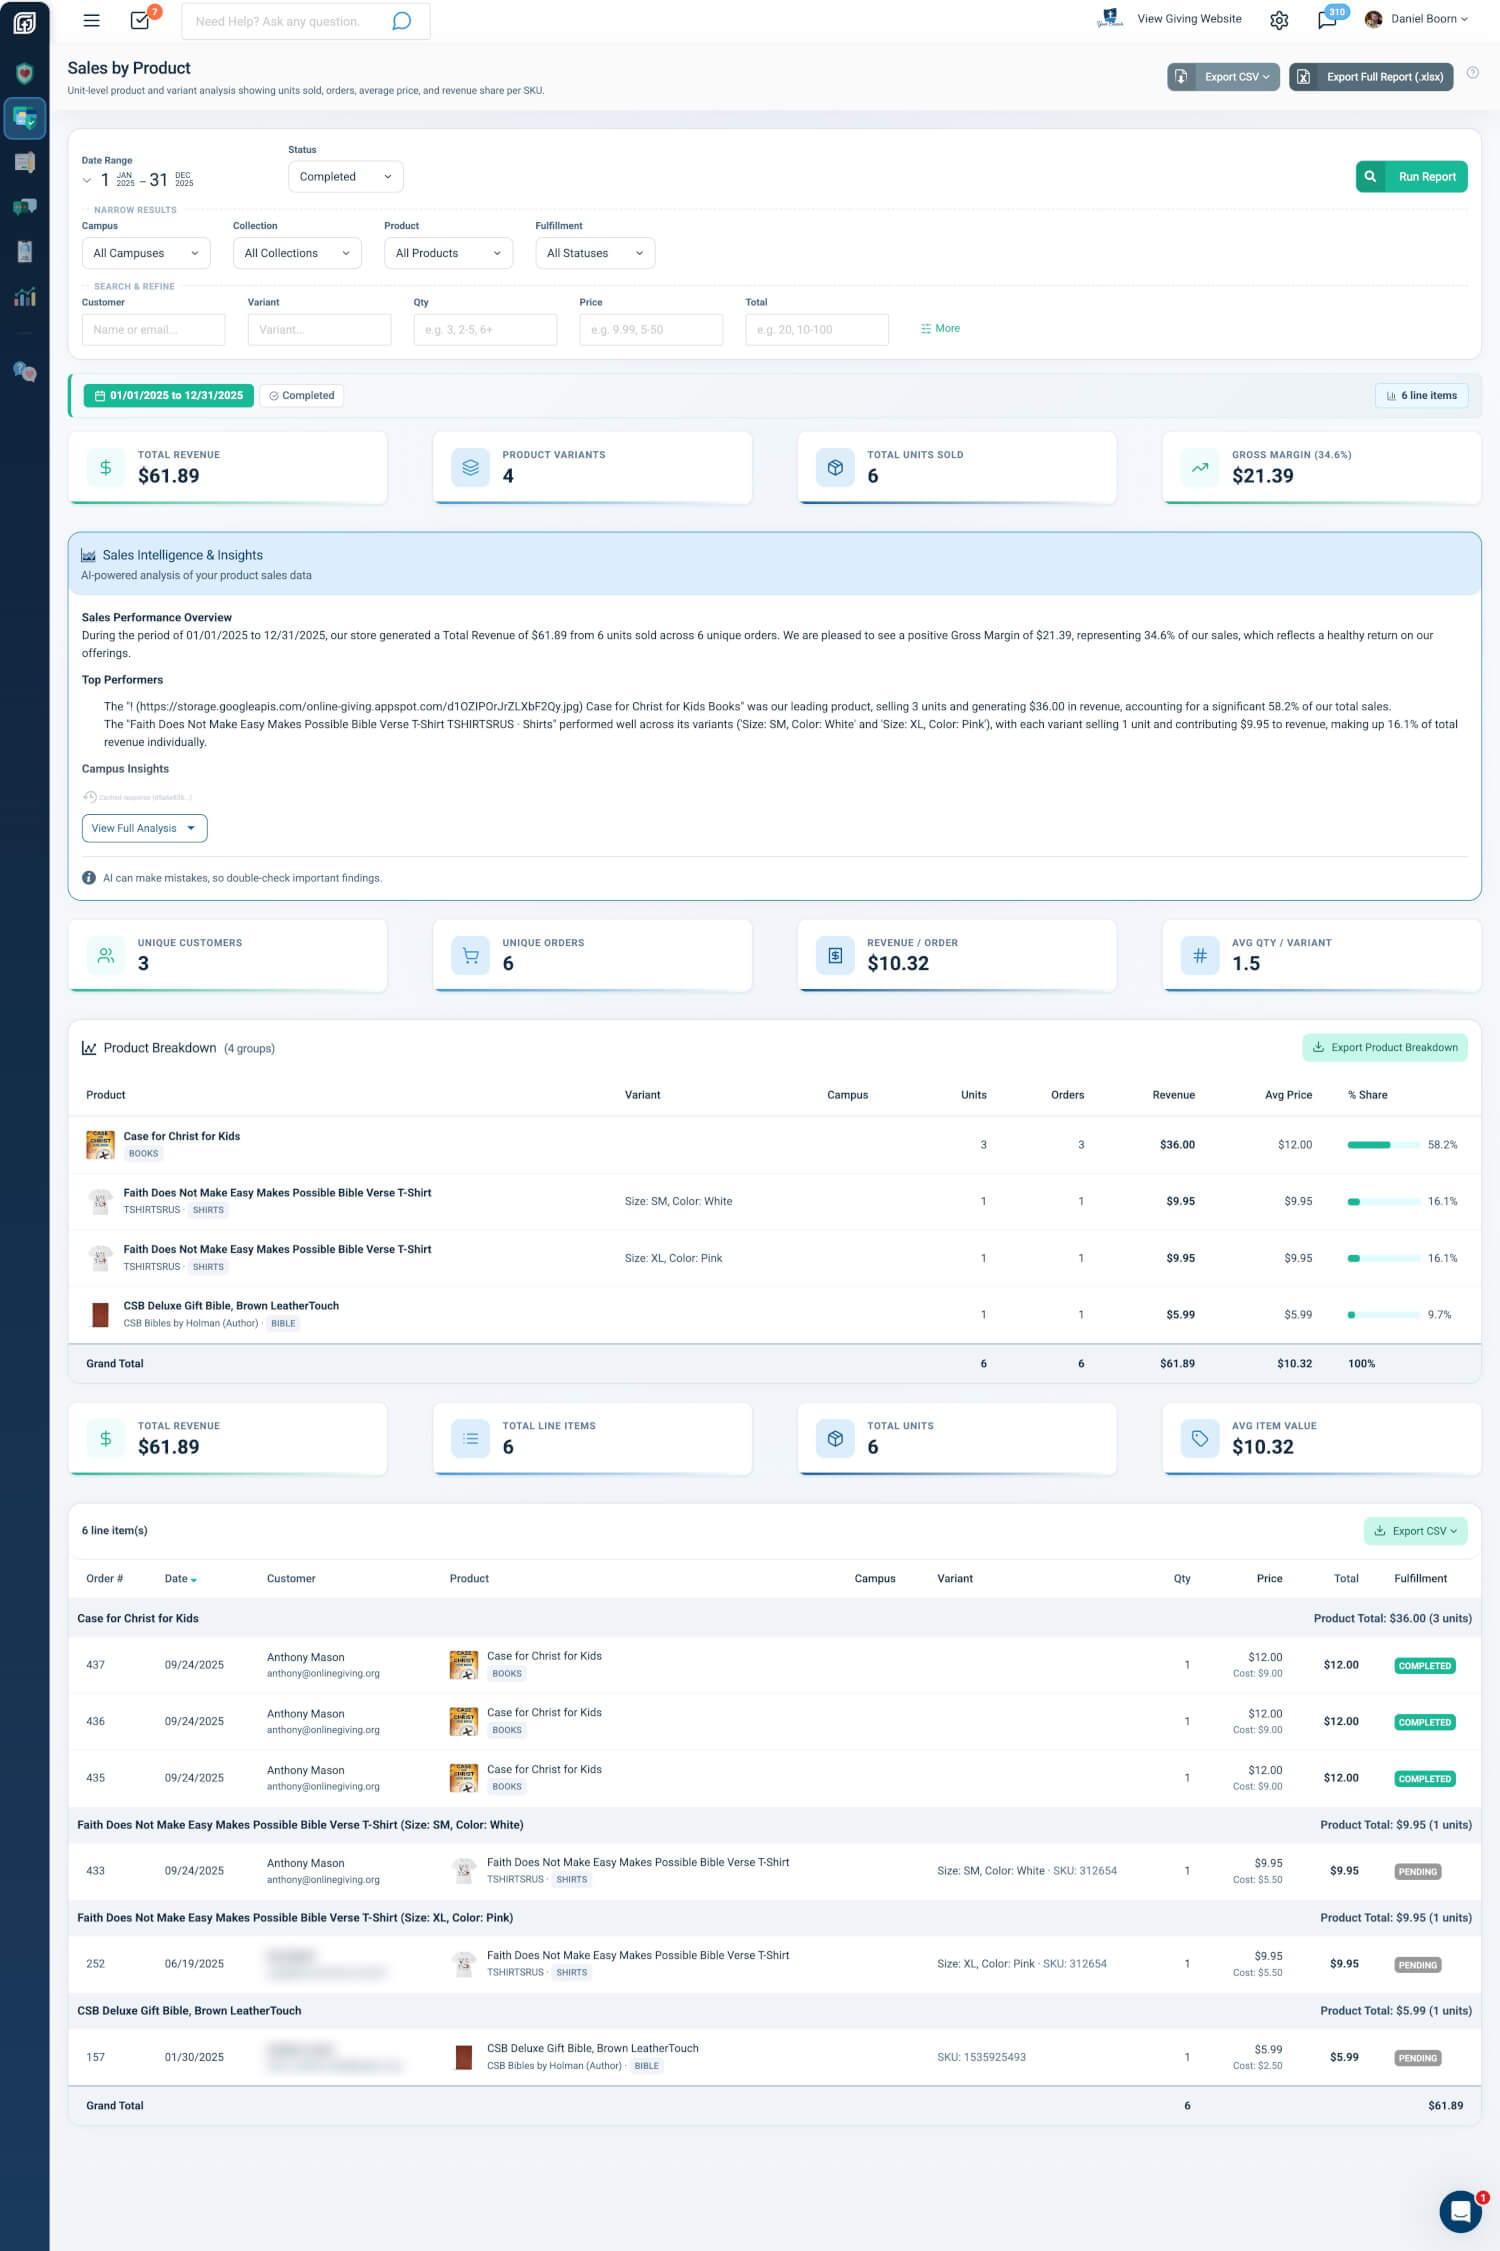
Product Breakdown Table
The Product Breakdown Table shows one row per product and variant combination, sorted by revenue from highest to lowest.
- Product Name + Thumbnail: Product name with image, vendor name, and product type badge
- Variant: Specific variant (e.g., Size: Large, Color: Blue)
- Campus: Campus assignment (multi-campus organizations only)
- Units: Total quantity sold
- Orders: Number of distinct orders containing this product
- Revenue: Total revenue generated
- Avg Price: Average selling price per unit
- % Share: Percentage of total revenue with visual ranking bars
A Grand Total row at the bottom summarizes overall units, orders, revenue, and average price. Use Export Product Breakdown to download the summary table for reordering and inventory planning.
Practical outcome: Quickly identify top sellers, compare variant performance, and export product-level data without drilling into individual orders.
Line Items Under Product Headers
Below the product breakdown, each product groups its variants and line items. The table shows every individual order line nested under product headers, with subtotals per product and variant. Each row displays product thumbnails, variant details, and cost per item when available. Click any row to open the full invoice for order management.
Practical outcome: Move from summary totals to individual transactions for fulfillment verification, refunds, or order investigation—all without leaving the report.
Product-Specific Metric Cards
Two rows of metric cards give you the numbers that matter for the product view.
- Row 1: Total Revenue, Product Variants, Total Units Sold, Gross Margin (when cost data is available for at least half of items; otherwise Avg Price)
- Row 2: Unique Customers, Unique Orders, Revenue per Order, Avg Qty per Variant
Practical outcome: See "how much did we sell" and "how many items are moving" at a glance. Gross margin appears when cost data supports margin analysis.
AI Insights
The AI Sales Intelligence & Insights panel generates product-focused analysis. The briefing summarizes store performance with specific dollar amounts and counts; identifies best sellers and variant performance; provides pricing analysis; and offers inventory recommendations. Results are cached for faster loading. The panel can be expanded or collapsed with "View Full Analysis" / "Collapse Analysis."
Practical outcome: Raw metrics need interpretation. The AI briefing turns dozens of product-level data points into actionable intelligence for store and leadership teams.
Exports
- CSV (Product Summary): Dedicated Export Product Breakdown button; grouped summary table as CSV
- Excel (.xlsx): Full workbook with Products sheet plus Report Summary, Line Items, By Collection, By Order, By Customer; limited to 10,000 line items
Additional CSV options (All Line Items, By Collection, By Order, By Customer) are available from the page header and line items table header.
Practical outcome: Use the Product Summary CSV for inventory and reordering. Share the Excel workbook with stakeholders for structured, multi-sheet reporting.
Quick Start
- Go to Admin → Payment Reports and open the Sales by Product card.
- Choose a date range (Last Week, Last Month, Last Quarter, Last Year, Year to Date, or a custom range).
- Click View Report—your top products and variants are ranked by revenue with visual ranking bars and one-click access to order details.
At a Glance
- Product Breakdown Table: Spot top sellers and compare variant performance at a glance
- Visual ranking bars: See each product's share of total revenue instantly
- Line items under headers: Drill from totals into specific orders and transactions
- Metric cards: Answer "how much did we sell" and "how many items moved" without scrolling
- AI insights: Turn product data into pricing and inventory recommendations
- Exports (CSV, Excel): Support reordering, inventory planning, and stakeholder reports