Feature Updates 03/23/2026
See Every Conversation, Care for Every Person: The New Conversations Report
What’s New
Your chatbots are working hard for your ministry — greeting visitors, guiding prayer requests, collecting contact cards, and helping people take their next step. But how do you know which chatbots are actually connecting with people? How do you spot someone who started a conversation but never finished — someone who might be reaching out for help and slipping through the cracks?
Until now, you had no easy way to see the full picture. You’d have to dig through individual chatbot logs, manually track who responded and who didn’t, and hope nothing fell through the gaps.
Not anymore.
The new Conversations Report gives you a complete, real-time view of every chatbot conversation happening across your text ministry. See which chatbots are performing best, which conversations are stuck and need follow-up, and get AI-powered pastoral insights that help you care for the right people at the right time.

Where to Find It
Conversations is in your control panel at:
Text Marketing > Reports > Conversations
Any administrator with Giving Admin or Text Marketing Admin access can view this report. Just click the Conversations card on the Reports hub, pick your date range, and click View Report.
Know Exactly How Your Chatbots Are Performing
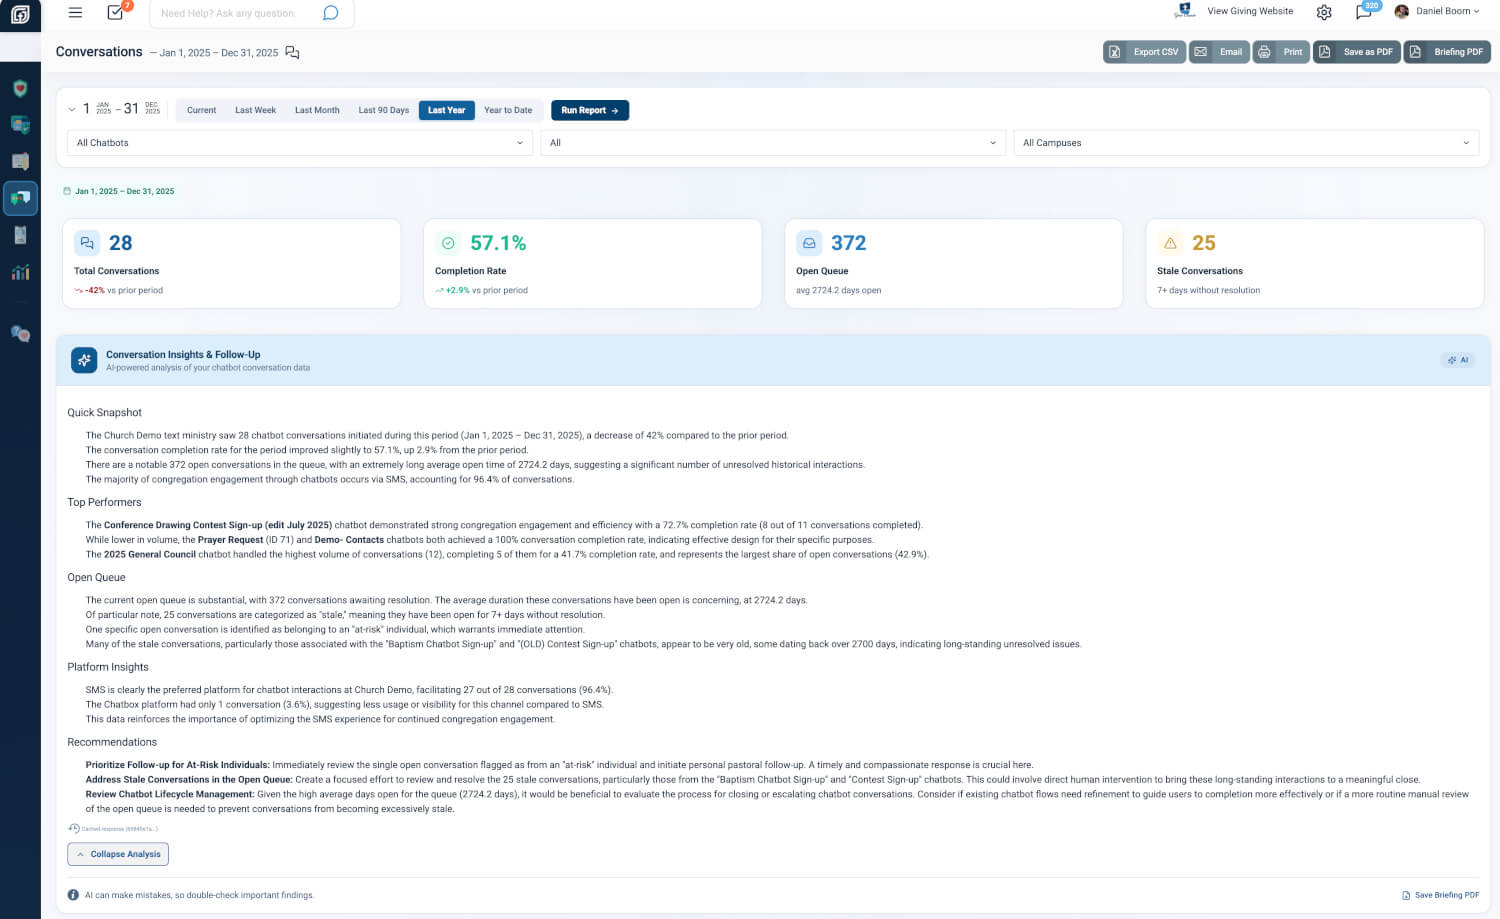
The moment you open the report, four snapshot cards tell you everything you need to know at a glance: Total Conversations started during your chosen period, the Completion Rate showing how many people finished the chatbot flow, the Open Queue of conversations still in progress, and a Stale Conversations count flagging anyone who has been waiting 7 or more days without resolution.
Each card shows how you’re trending compared to the prior period — so you can see at a glance whether engagement is growing or needs attention.
Why it matters: When your pastor asks “How are our chatbots doing?” you can answer in seconds — not after an hour of digging. One glance tells you whether your text ministry is thriving or needs a course correction.
AI-Powered Insights Written for Your Team
An AI Conversation Insights panel analyzes your chatbot data and writes a plain-language briefing covering your top-performing chatbots, any stale conversations that need pastoral follow-up, platform trends, and specific recommendations your team can act on this week.
The analysis is collapsible so it doesn’t overwhelm the page, and you can save it as a standalone Briefing PDF to share with your leadership team, elder board, or volunteer coordinators.
Why it matters: Instead of staring at numbers and trying to figure out what they mean, you get a written summary that reads like a memo from your most data-savvy team member. When your executive pastor asks “What should we do about our text outreach?” — hand them the briefing.
See Which Chatbots Connect Best
The Chatbot Performance table ranks every chatbot by conversation volume, showing how many conversations each one started, how many completed, the completion rate, and how many are still open. Animated share bars make it easy to see which chatbots are carrying the load.
Completion rates are color-coded — green for strong performers, amber for moderate, and red for chatbots that might need attention. Click any chatbot name to jump directly to its settings, or click the conversation count to filter the report to that specific chatbot.
Why it matters: If your “Contact Card” chatbot has an 89% completion rate but your “Prayer Request” chatbot is at 7%, you know exactly where to focus. Maybe the prayer flow has too many steps, or the wording needs to be more inviting. Now you have the data to make that call.
Watch Conversations Flow from Start to Finish
The Conversation Funnel shows you how conversations move through four stages: Started, Completed, Open, and Abandoned. At a glance, you can see your completion and abandonment percentages side by side.
Next to the funnel, a Platform Distribution chart shows where your conversations are happening — SMS, chatbox, or other channels — so you know which platforms your congregation prefers.
Why it matters: If you see a high abandonment rate, it might mean your chatbot flow is too long, too confusing, or asking for information people aren’t ready to share. This funnel gives you the clarity to simplify and improve — so more people complete the conversation and take their next step.
Discover When Your Congregation Engages Most
The Conversation Activity by Day chart reveals which days of the week generate the most chatbot conversations. A highlighted Peak Day banner calls out your busiest day with the exact count and percentage of weekly total.
Summary stats show your total conversations, daily average, and how many days of the week are active.
Why it matters: If Wednesday drives 61% of your chatbot conversations, that tells you something powerful about when your congregation is most engaged. Maybe it’s midweek service night. Maybe it’s when your prayer team sends their weekly text. Either way, you can schedule your outreach around the days people are already responding.
Never Let a Conversation Fall Through the Cracks
The Open Conversations Queue is the pastoral heart of this report. It lists every conversation still in progress, showing the phone number, which chatbot they’re interacting with, when the conversation started, how many days it has been open, and the current status.
Conversations open 7 or more days are flagged as Stale in red, with an amber warning banner telling you exactly how many need attention. Each row also shows an Engagement Score and Risk Level so you can prioritize the people who need care the most.
Phone numbers link directly to user profiles, and chatbot names link to chatbot settings — so you can take action with a single click.
Why it matters: Someone texted your church’s prayer line 10 days ago and never got a response. That’s not a data point — that’s a real person who reached out for help. The Open Conversations Queue makes sure no one gets forgotten. When you see a stale conversation from an at-risk individual, you can pick up the phone and follow up before it’s too late.
At a Glance
- Snapshot Metric Cards: See total conversations, completion rate, open queue, and stale count in seconds
- AI Conversation Insights: Get a written briefing with recommendations you can share with your leadership team
- Chatbot Performance Table: Know which chatbots are connecting with people and which need improvement
- Conversation Funnel: Understand where people drop off so you can simplify and improve chatbot flows
- Platform Distribution: See whether your congregation prefers SMS, chatbox, or other channels
- Day-of-Week Activity: Discover your peak engagement days and schedule outreach accordingly
- Conversation Health Summary: Monitor average days open, at-risk people, active chatbots, and prior-period trends
- Open Conversations Queue: Spot stale conversations and at-risk individuals who need pastoral follow-up
- CSV Export & PDF: Download data, print the report, or save a branded PDF for your board
- Scheduled Email Delivery: Automatically send the report to your team on a weekly, monthly, or yearly schedule
- Campus Filtering: Multi-campus churches can filter every section by campus
Try It Now
- Go to Text Marketing > Reports and click the Conversations card
- Select Last Year or pick a custom date range, then click View Report
- Scroll to the Open Conversations Queue — if you see any stale conversations flagged in red, click through to the user profile and follow up today