Feature Updates 06/05/2022
New OnlineGiving.org Control Panel > Interactive Chart for Donations
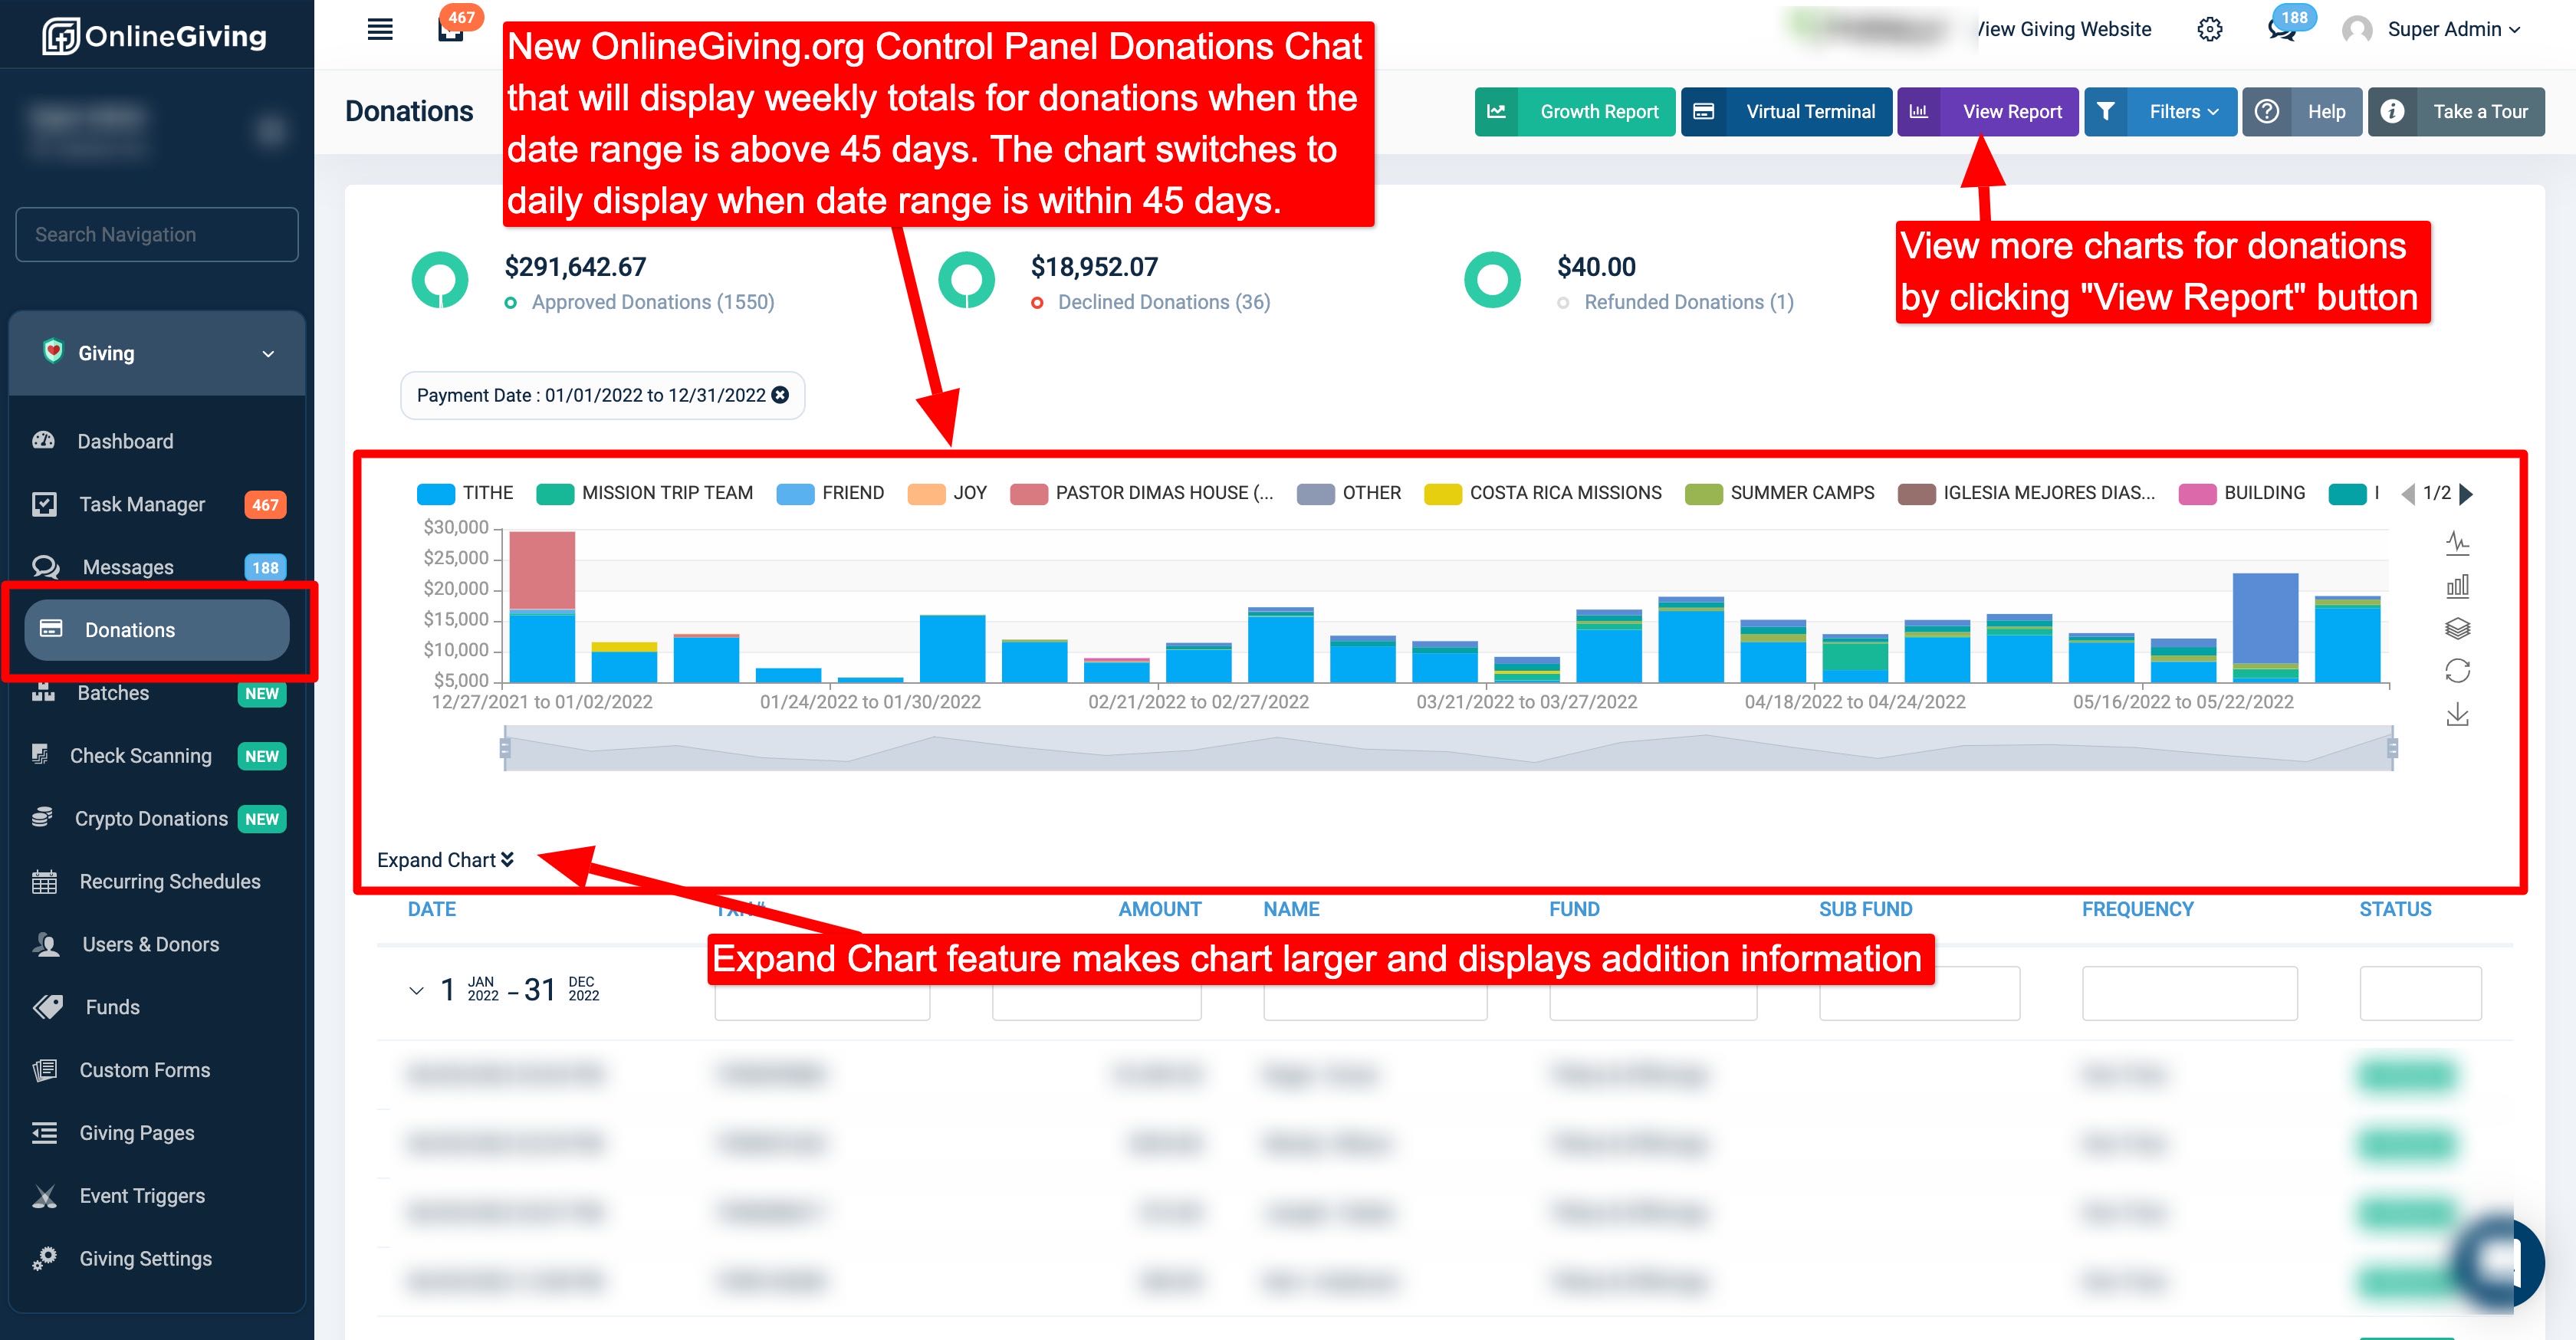
We're pleased to announce that we've enhanced the OnlineGiving.org control panel view donations feature to display an interactive chart at the top of the page designed to offer a quick glance at totals over the administrative date range and contribution filters. The interactive charge will automatically display weekly totals when date ranges over 45 days are selected, and daily totals when date ranges under 45 dates are selected. A church administrator may always click the "View Report" button to obtain a more detailed breakdown, including additional interactive charts.
Preview of New Interactive Chart for Donations